Uneekor launch monitors cover a lot of ground (and a decent amount of ceiling too). The lineup runs from compact floor units to a portable model to overhead options, which means you can build around your space instead of cramming a launch monitor into one that was never designed for it.
You can go floor-mounted, rear-mounted or overhead. You can get ball data only or add club and swing feedback. You can even take one to the range. Six models, all with a different reason to exist.
Here is how the EYE MINI CORE, EYE MINI LITE, EYE MINI, EYE XR, EYE XO and EYE XO2 stack up.
Uneekor Launch Monitors Compared
| Model | Setup Style | What to Know |
|---|---|---|
Uneekor EYE MINI |
Floor-mounted, indoor/outdoor | Portable Uneekor option for golfers who want simulator use and range use. |
EYE MINI LITE |
Floor-mounted, indoor | Indoor-only option with ball and club data. Requires a PC and power, so it is not portable like the EYE MINI. |
EYE MINI CORE |
Floor-mounted, indoor | Ball-data focused option for golfers who want fast simulator play without extra club analytics. |
Uneekor EYE XO |
Overhead, indoor | High-end overhead launch monitor for permanent simulator spaces. |
Uneekor EYE XO2 |
Premium overhead, indoor | Premium overhead option for serious home builds and commercial-style simulator setups. |
Uneekor EYE XR |
Rear-mounted, indoor | Clean permanent setup with no marked balls or club stickers. |
Uneekor Launch Monitor Timeline
Uneekor started with fixed overhead units and has spent the last few years filling in the rest of the map.
May 2019
QED helped establish Uneekor in the overhead indoor launch monitor space.
February 2020
EYE XO expanded Uneekor's overhead lineup for permanent indoor simulator setups.
February 2023
EYE XO2 added another premium overhead option for serious home and commercial simulator builds.
April 2023
EYE MINI brought Uneekor into the portable, floor-mounted launch monitor space.
January 2024
EYE MINI LITE joined the EYE MINI family as an indoor-only floor-mounted option.
April 2025
EYE XR added a rear-mounted option with no marked balls or club stickers.
October 2025
EYE MINI CORE gave golfers a more streamlined EYE MINI-family option focused on fast ball data and simple simulator play.
EYE MINI vs. EYE MINI LITE vs. EYE MINI CORE
The EYE MINI family is where Uneekor can get a little confusing. Same general floor-mounted idea, three very different reasons to buy.
The simplest way to sort it out: EYE MINI is the portable one. EYE MINI LITE is the indoor-only one with club data. EYE MINI CORE is the streamlined one for ball data.
| Model | Best Reason to Buy | What You Get | What You Give Up |
|---|---|---|---|
| EYE MINI | Portability | Indoor simulator use, range use, ball data, club data and a built-in display. | Higher price than the LITE or CORE. |
| EYE MINI LITE | Indoor club data without going overhead | Ball and club data in a floor-mounted setup for a dedicated indoor simulator. | No battery, no built-in display and no range-friendly portability. |
| EYE MINI CORE | Simple ball data | Fast ball flight feedback for simulator rounds and casual practice. | No built-in club data. |
Before You Pick One, Think About How You'll Use It
Permanent simulator or something you move around?
The EYE MINI is the only Uneekor launch monitor built to travel. Every other model in the lineup, including the EYE MINI CORE and EYE MINI LITE, assumes you are setting it up and leaving it there.
Ball data, club data, or both?
Ball data shows you what the ball did. Club data tells you what the club was doing when it made contact. For casual simulator rounds, ball data is usually enough. If you are actively working on your swing, club path, face angle and attack angle start to matter, and you will want a unit that captures them.
Floor, rear, or overhead?
Floor-mounted units sit beside the ball. Rear-mounted units sit behind the hitting area. Overhead units mount above it. The right answer depends on your ceiling height, how much floor space you want to keep clear and how permanent the setup is going to be.
Uneekor's Launch Monitors - Tests and Reviews
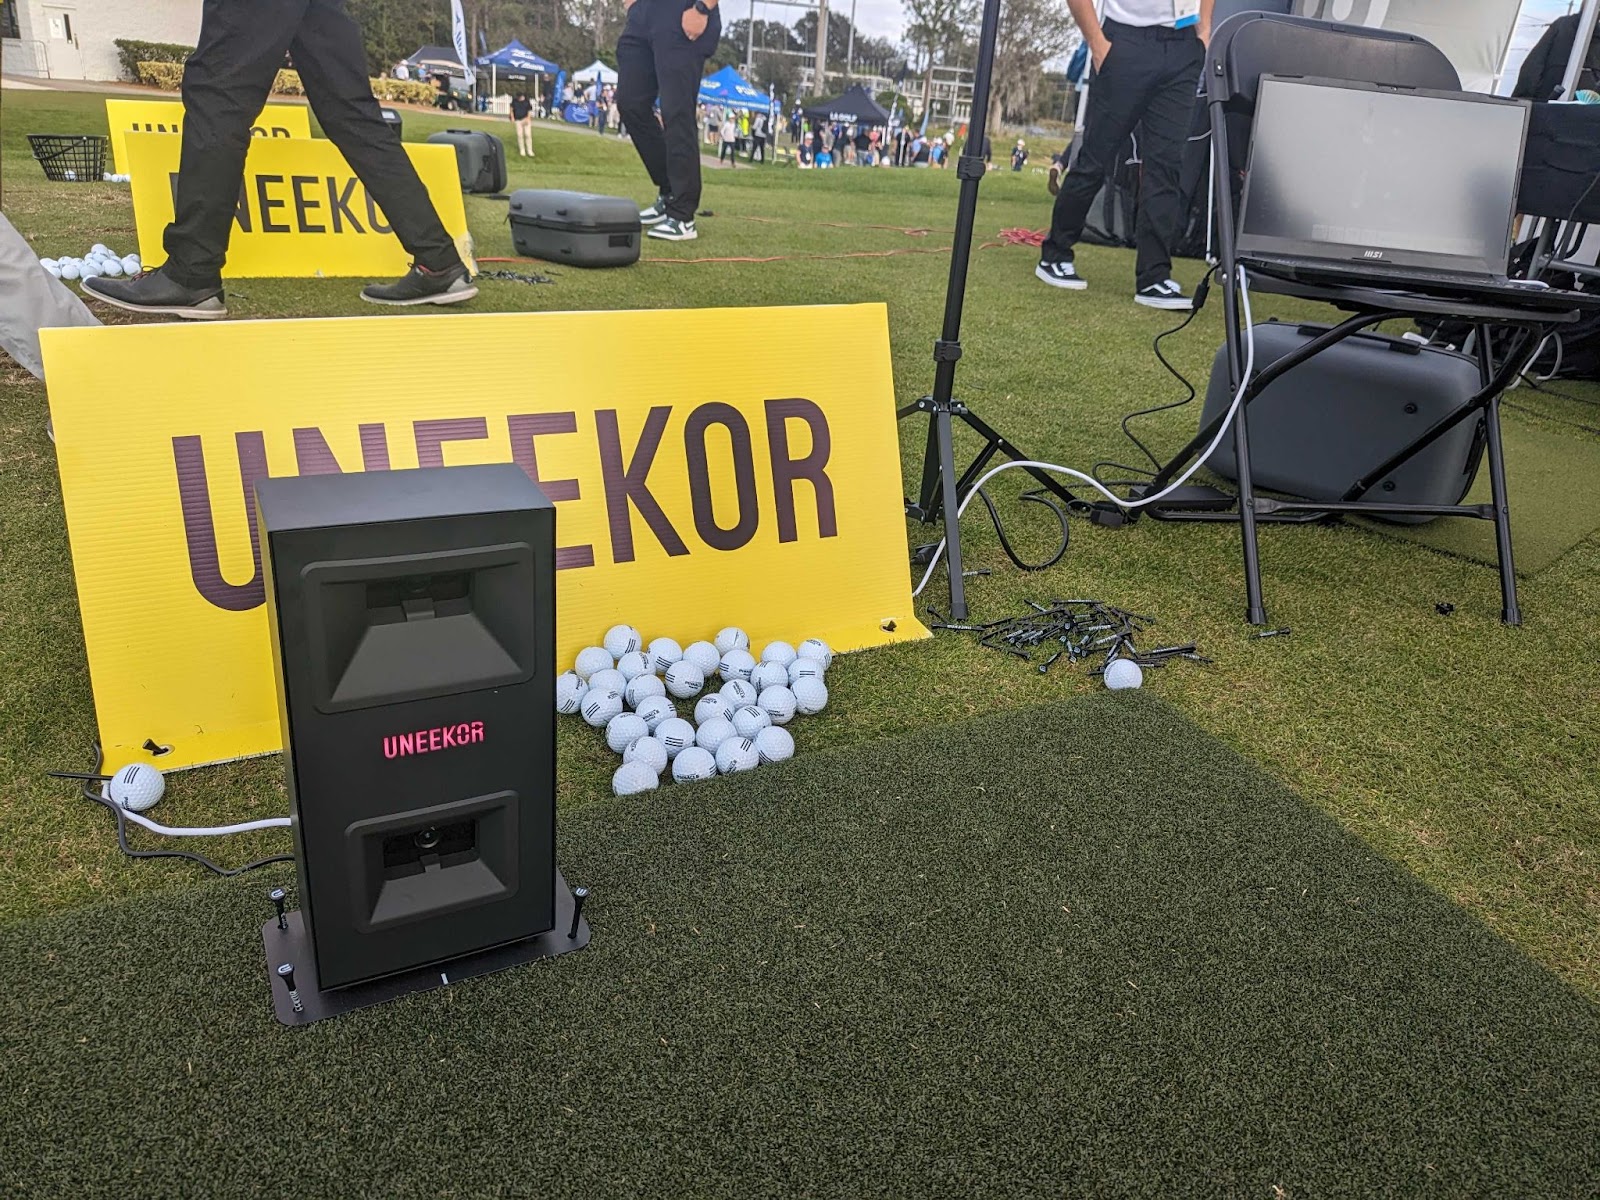
Uneekor EYE MINI: Portable Uneekor Launch Monitor

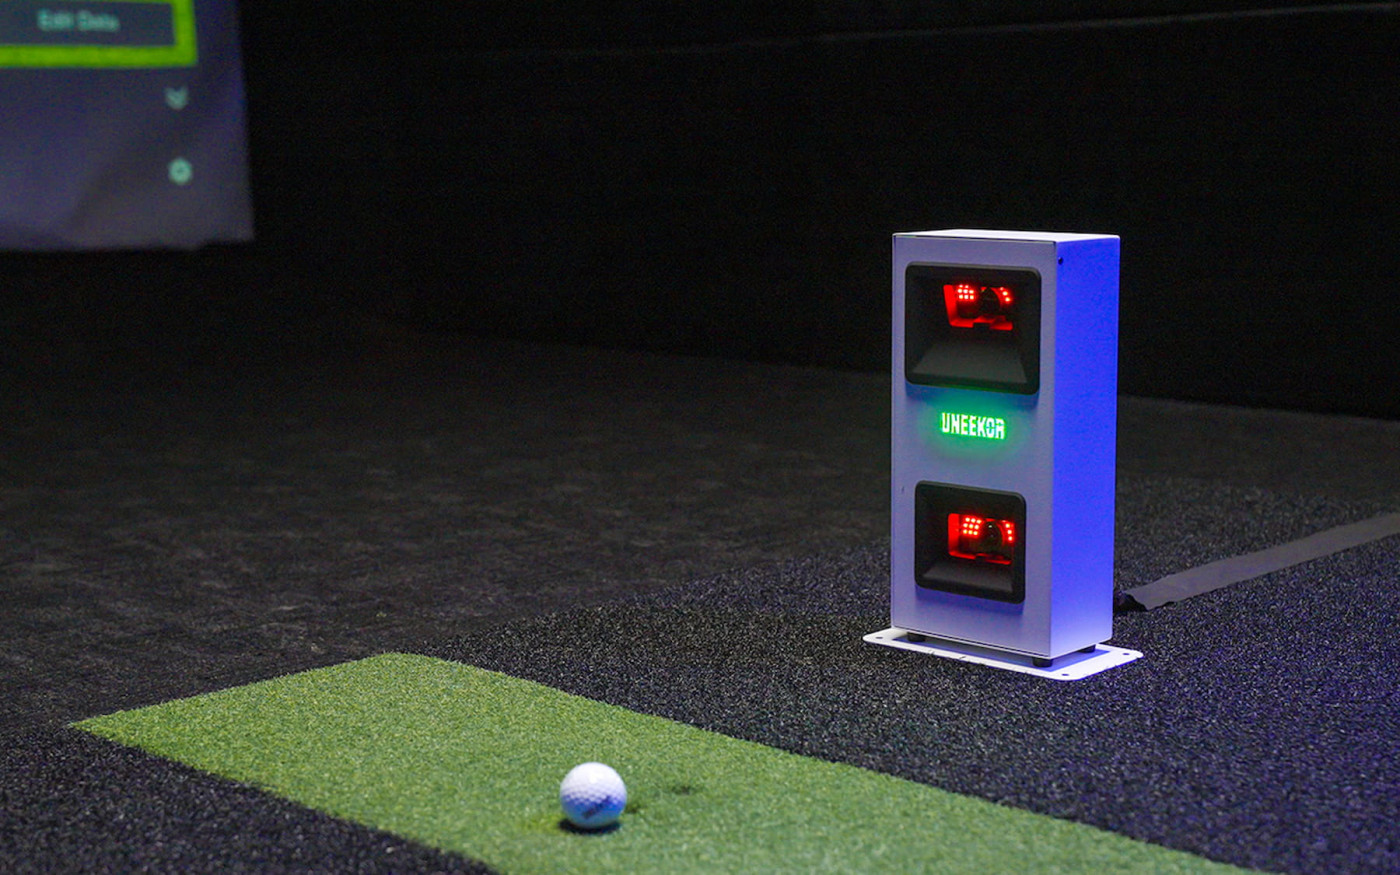
The EYE MINI is a floor-mounted, photometric launch monitor you can set up beside the ball indoors or throw in a bag and take to the driving range.
It runs on Uneekor View software, works with accessories like Swing Optix Cameras, and uses Ball and Club Optix technology. Club data requires stickers on the club, which is a minor hassle most people stop noticing after the first session.
EYE MINI Data Parameters
The EYE MINI records ball speed, launch angle, launch direction, back spin, side spin, club speed, club path, club attack angle, smash factor, carry distance, side distance and apex height.
What's in the Box
- EYE MINI Launch Monitor
- EYE MINI Carrying Case with Carrying Strap
- View Software for PC and View iPad app
- Power Cable and Adapter
- CAT6 Ethernet Cable
- EYE MINI Club Stickers
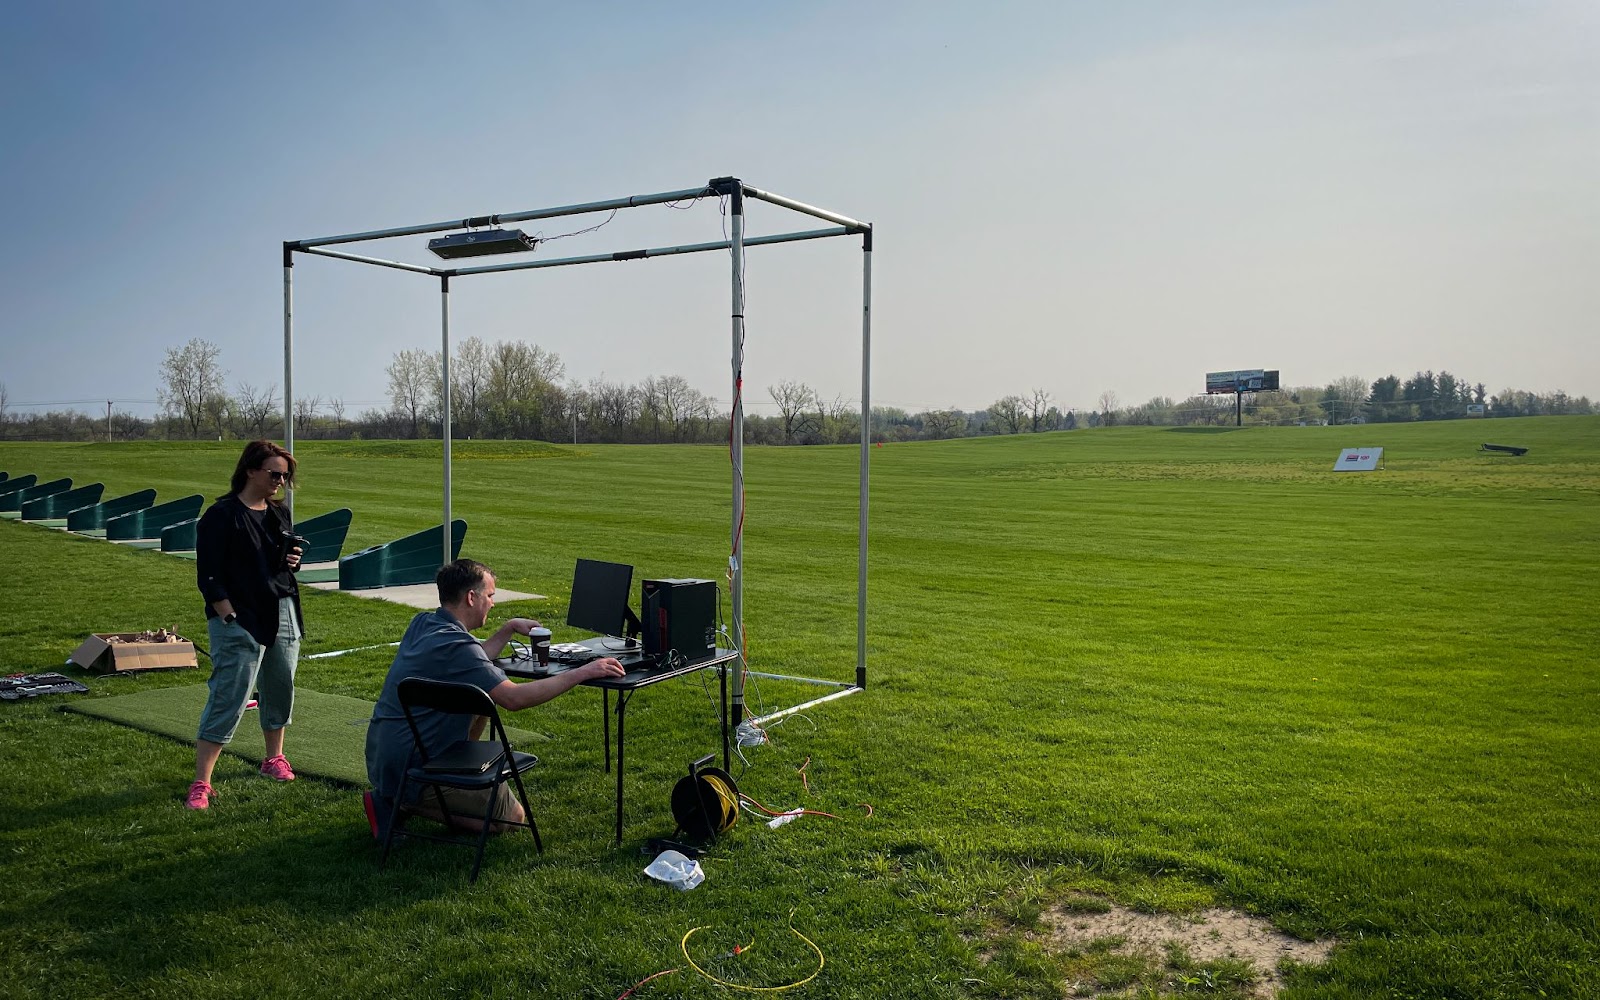
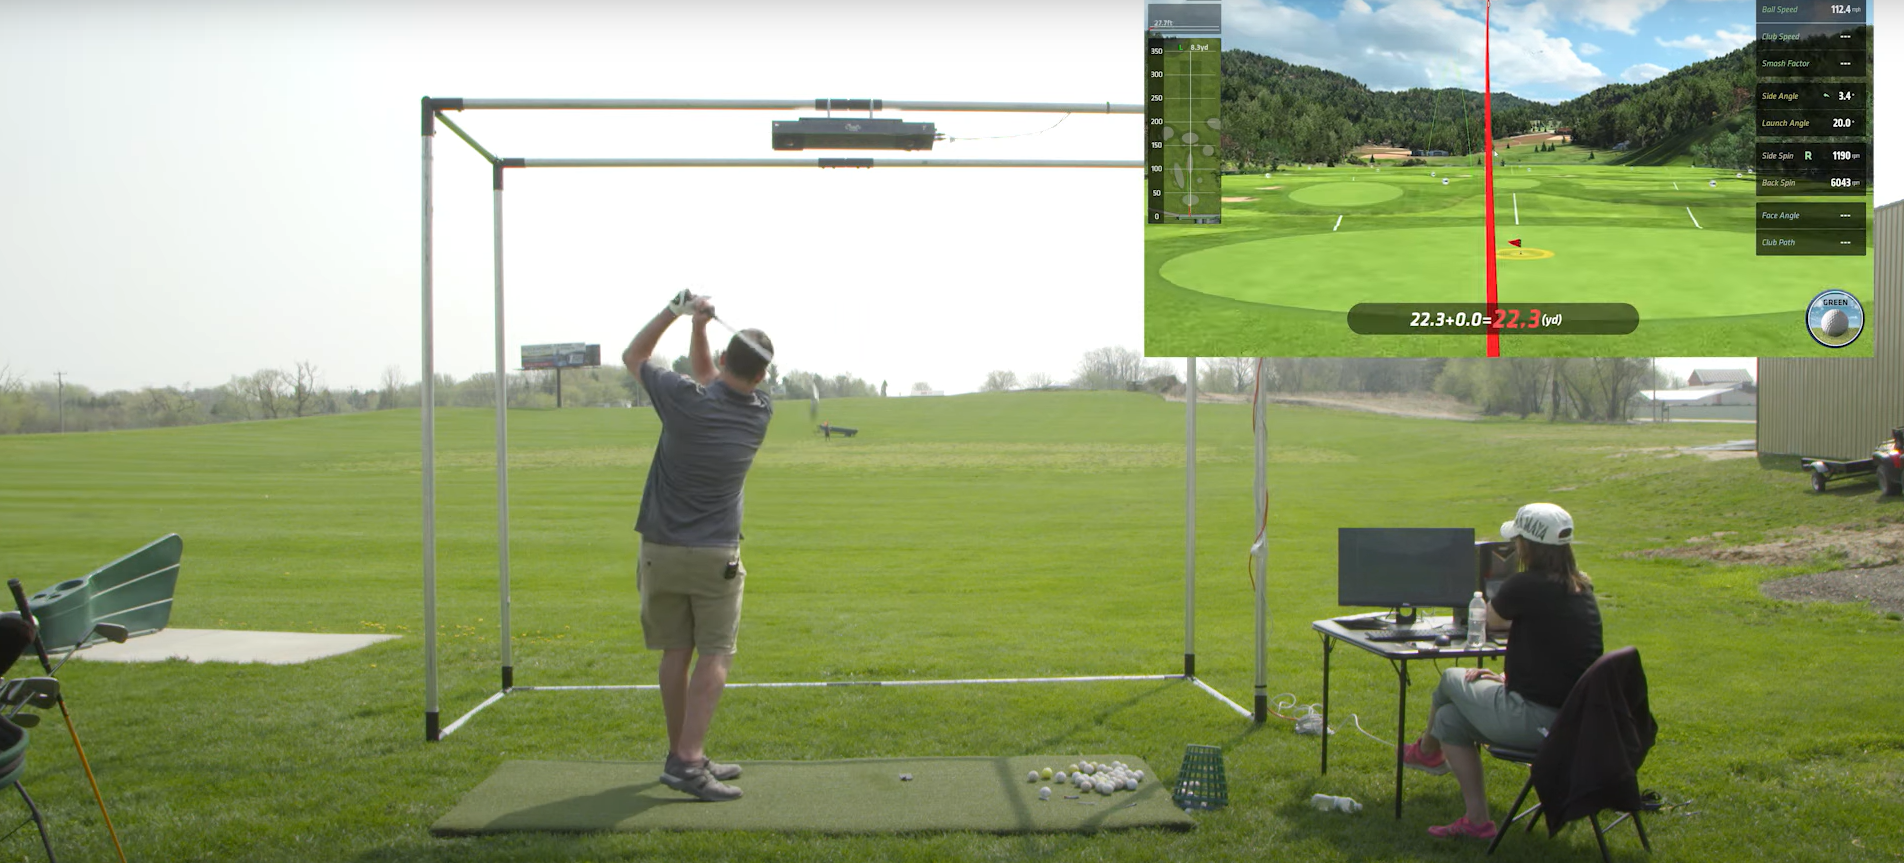
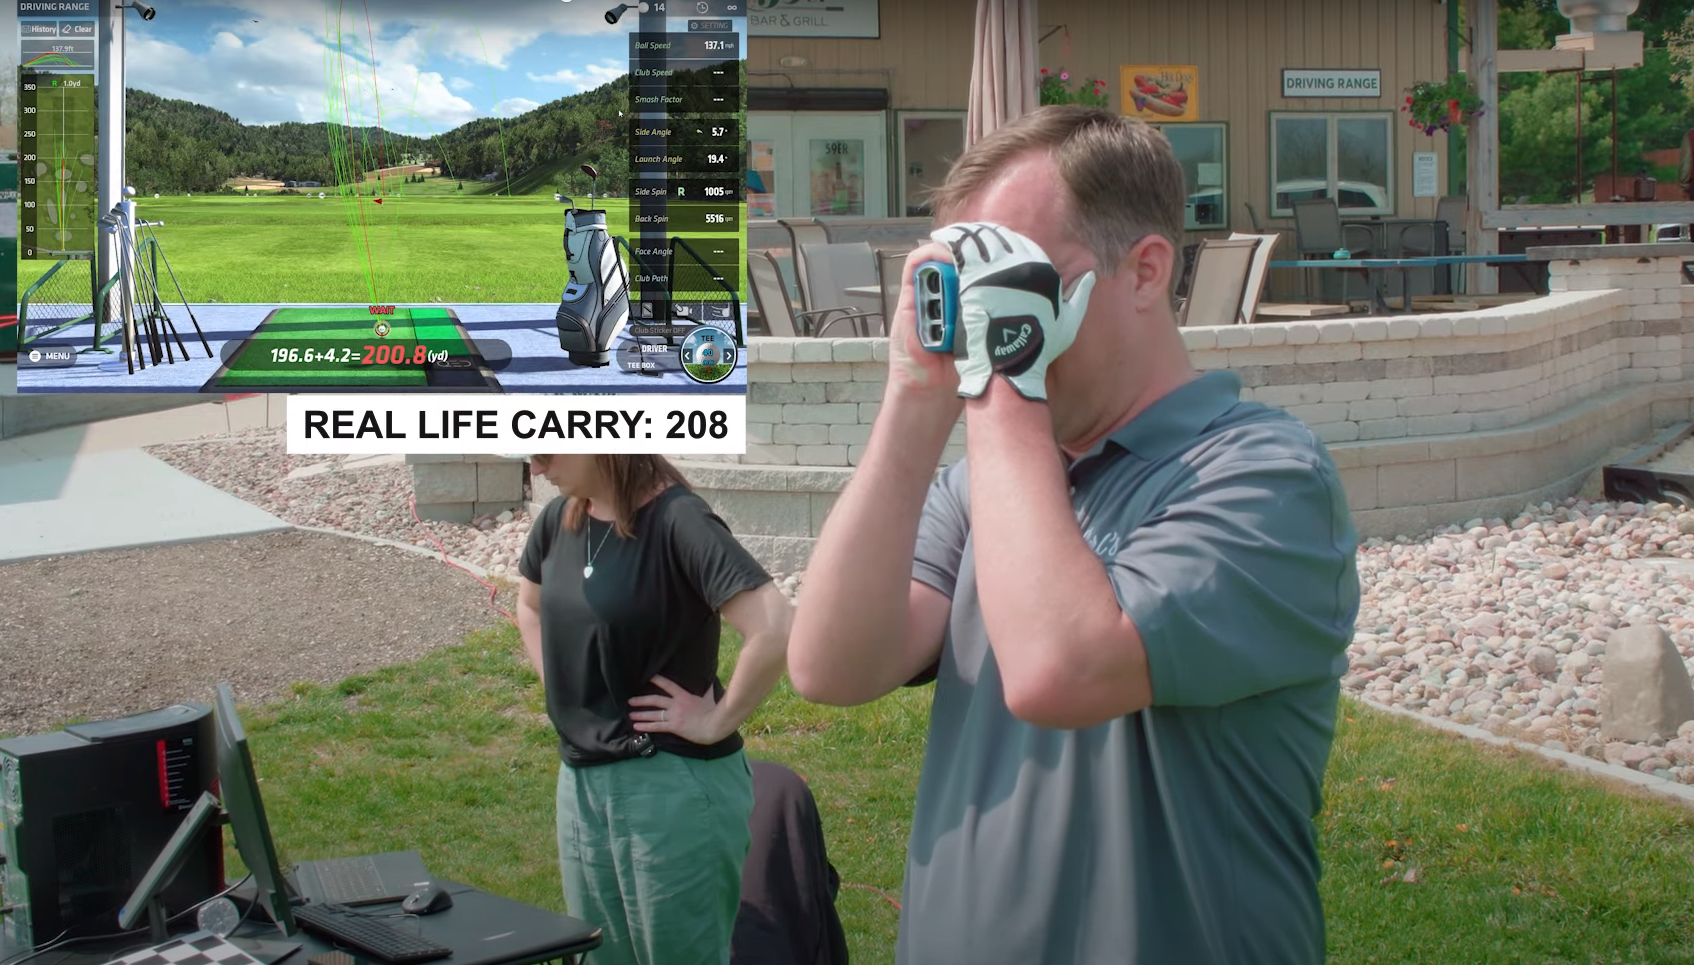
What We Found in EYE MINI Outdoor Testing
We tested the EYE MINI by comparing its carry distance numbers against real-life carry measured with a rangefinder. Tim hit 60 shots total: 20 with driver, 20 with 6 iron, 20 with pitching wedge.
Outdoor testing is never clean. Weather, an elevated tee and human ball spotting all introduce error that the unit cannot account for.
EYE MINI outdoor test highlights:
Driver: 11.65 yards / 5.61% average difference
6 iron: 3.85 yards / 2.22% average difference
Pitching wedge: 5.95 yards / 4.88% average difference
The 6 iron numbers were the strongest. Driver and wedge had a handful of outliers that pulled the averages up, but overall, decent performer.
Uneekor EYE MINI LITE: Indoor Floor-Mounted Data Without Going Overhead
The EYE MINI LITE is a floor-mounted, indoor-only launch monitor. Think of it as the EYE MINI without the portability. It needs a PC and a power connection, so it stays where you put it, which for most people is fine since their simulator is not going anywhere either.
It uses the same camera-based technology to capture ball and club data, works with Uneekor software and supports third-party simulator software depending on which package you are running.
The EYE MINI LITE captures 10 data parameters: ball speed, back/side spin, side angle, side distance, launch angle, carry distance, club speed, attack angle, smash factor and club path.
 EYE SIM
The EYE MINI LITE also comes as part of Uneekor's EYE SIM, a bundled solution that pairs the launch monitor with a gaming PC and touchscreen monitor for a single-box purchase.
Uneekor EYE MINI CORE: Simple, Fast Ball Data
The EYE MINI CORE is the stripped-down option in the EYE MINI family. No club analytics, no data overload after every swing. Just ball speed, spin, launch angle, carry distance and the other numbers that tell you what the ball actually did.
It is built for golfers who play more simulator rounds than practice sessions. If your goal is to get a round in, not audit your swing, the CORE keeps things moving. You get Uneekor software compatibility and clean ball flight data without paying for club tracking you will probably ignore.
The tradeoff is real: there is no club path, face angle or attack angle data. If that information matters to you, step up to the EYE MINI LITE, EYE MINI, EYE XR, EYE XO or EYE XO2.
Uneekor EYE XR: Rear-Mounted, Clean and Low-Fuss

The EYE XR mounts about 3.5 feet behind the hitting area, out of the swing path, out of the way. No marked balls, no club stickers. Uneekor handles club data through AI Club Tracking and ball data through Dimple Optix, so you grab any ball off the shelf and go.
It runs on a single PoE cable, which handles both power and data. Less cable management, cleaner install.
No Marked Balls
Use your ball of choice instead of marked balls.
No Club Stickers
AI Club Tracking reads club data without stickers or markings.
Power over Ethernet
One cable handles both power and data for a cleaner installation.
Video Replay
Club Optix gives a slow-motion look at club impact, with swing replay available when paired with compatible cameras.
The EYE XR captures 19 data points out of the box, including ball speed, spin, launch angle, carry distance, club speed, smash factor and club path.

This one is not for anyone who needs to move the unit around. But for a permanent sim space where low-maintenance performance matters, the EYE XR is hard to argue with.
Uneekor EYE XO: Overhead Launch Monitor for Permanent Simulator Spaces
The EYE XO is an overhead launch monitor built for controlled indoor simulator spaces. We did take it outside once, mostly to see what would happen.
What We Learned From the EYE XO Outdoor Test
We mounted the EYE XO to a Carl's Place Pro Enclosure frame, set up a hitting mat, ran power and a computer, calibrated the unit, then tested across three clubs. Wind, range balls, heat, humidity and an uphill section of the range all worked against clean numbers.
EYE XO outdoor test highlights:
Pitching wedge: 4.3 yards / 3.92% average difference
6 iron: 3.35 yards / 2.19% average difference
Driver: 7.8 yards / 3.63% average difference
Overall: 5.15 yards / 3.25% average difference across 60 swings
The recommendation does not change: the EYE XO belongs indoors. What the outdoor test gave us was a useful reference point for how its carry numbers hold up against real ball flight.
Uneekor EYE XO2: Premium Overhead Setup
The EYE XO2 is the top of the Uneekor overhead lineup. It is built for permanent indoor setups where you want the launch monitor out of the hitting area entirely and the data as clean as possible.
We used it as the benchmark unit in a Carl's Place showroom comparison against another overhead launch monitor, testing carry distance, ball speed and total spin across driver, 6 iron and pitching wedge.
For serious home simulators, coaching bays and commercial-style builds, the EYE XO2 is the overhead unit to look at when the launch monitor needs to disappear into the ceiling and the data needs to hold up.
Do You Actually Need Club Data?
If you mostly want to play simulator rounds and see your shot shape, ball data is probably enough. The EYE MINI CORE was built for exactly that use case.
Club path, face angle, attack angle, smash factor: that information becomes useful when you are actively trying to fix something. Models like the EYE MINI LITE, EYE MINI, EYE XR, EYE XO and EYE XO2 capture all of it.
Floor, Rear or Overhead: What Fits Your Room?
Floor-mounted Uneekor options
The EYE MINI CORE, EYE MINI LITE, and EYE MINI all sit beside the ball. The CORE and LITE are indoor-only. The EYE MINI is the one you can take to the range.
Rear-mounted Uneekor option
The EYE XR sits behind the hitting area. No marked balls, no club stickers, one cable.
Overhead Uneekor options
The EYE XO and EYE XO2 mount above the hitting area. Neither is portable, but once they are up, they stay out of the way completely.
Final Thoughts
The right Uneekor launch monitor comes down to three questions: where are you putting it, do you need club data, and are you ever moving it?
The EYE MINI CORE is the easy answer for golfers who want to play rounds and skip the analytics. The EYE MINI LITE adds club data in the same floor-mounted form. The EYE MINI is the one if portability matters at all. The EYE XR is worth a close look for permanent setups where you want no marked balls, no stickers and a genuinely clean install. For overhead builds, the EYE XO2 is what serious home simulators and commercial spaces tend to land on.
Still working through it? Carl's Build Your Own Golf Simulator tool will walk you through all the stuff you need to build your golf simulator. Try it out.

Search articles by tag:
Launch Monitors UneekorRelated Posts

Launch Monitors
Most Important Launch Monitor Data | According To A Golf Pro
DIY Golf Enclosures, Golf Simulators, Launch Monitors
Golf simulator ideas for righties and lefties
Launch Monitors
Uneekor EYE MINI CORE: Zero Delay, Maximum Play