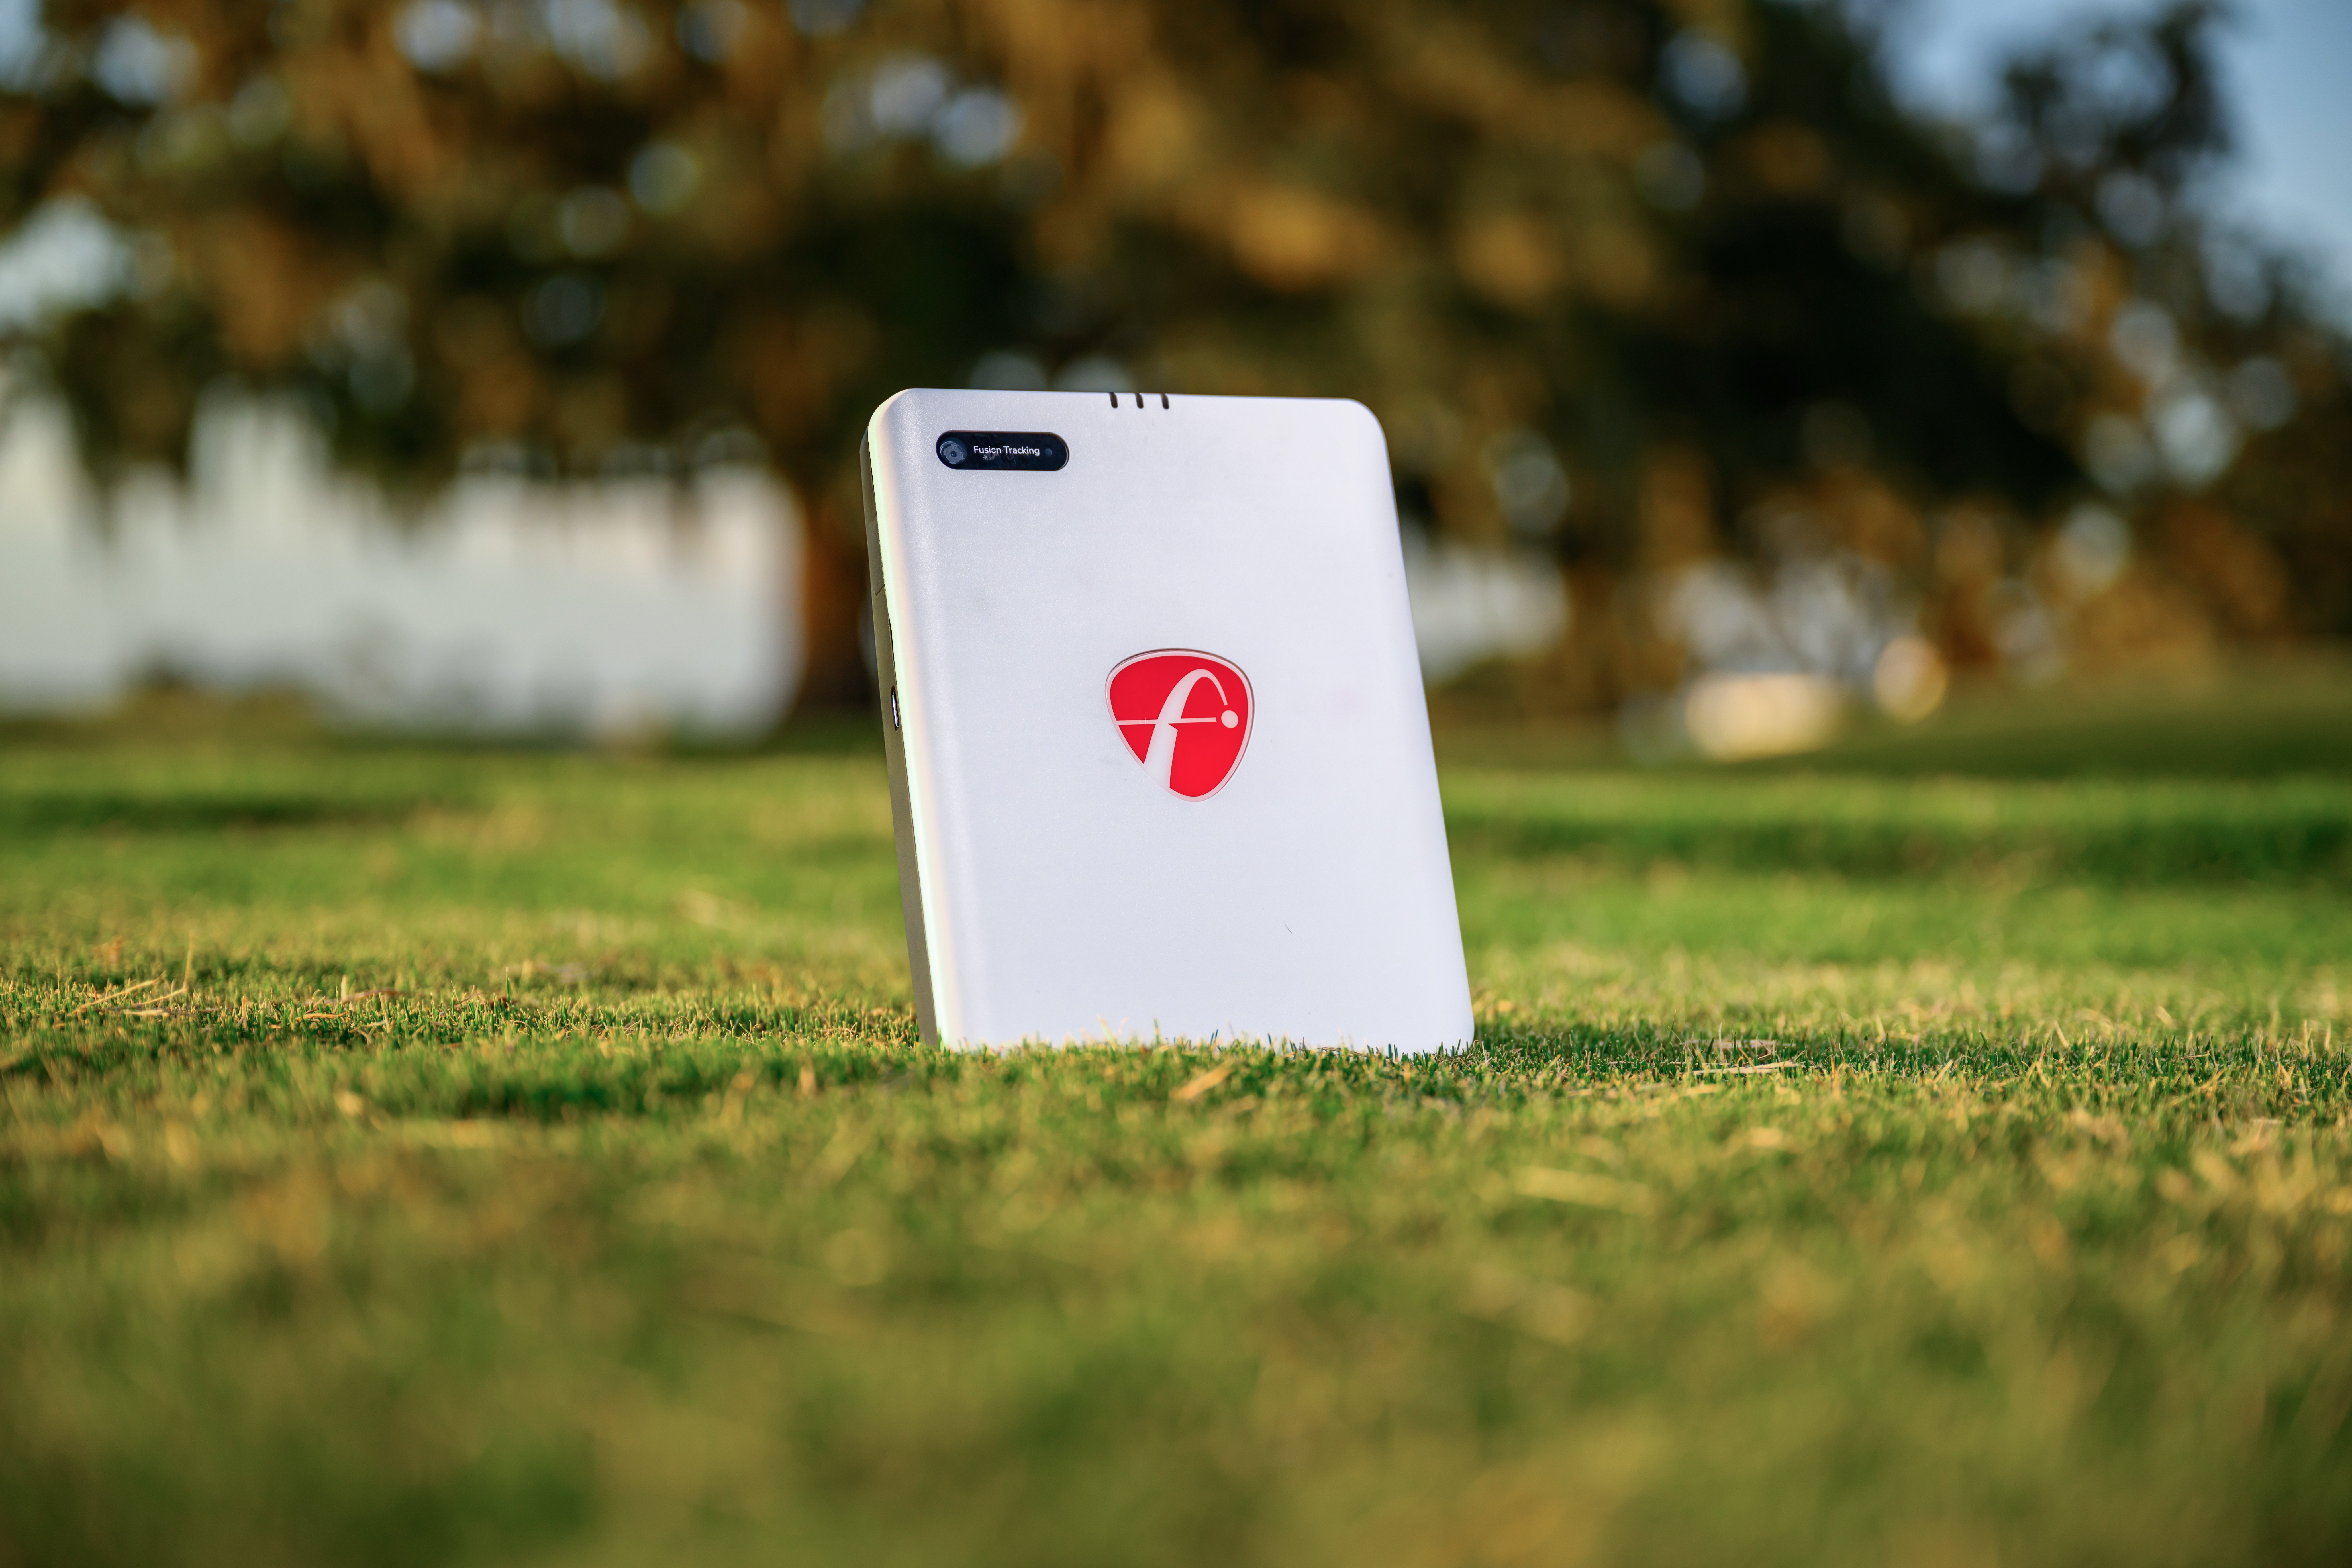
Testing for accuracy, the Carl's Place team compared real-life data at the driving range with numbers from the FlightScope Mevo Gen2 launch monitor.
FlightScope’s new Mevo Gen2 launch monitor promises pro-level accuracy without the subscription fees, so we took it to the range to see how it stacks up against real world data.
We visited our brand spanking new testing facility (Carl's Backyard) in Milton, Wis., to see how the Mevo Gen2 performed.
Setting up the Mevo Gen2 is simple and takes just a few minutes. Start by placing the unit 8 feet directly behind the golf ball, ensuring it's level and aligned with your target line. Outdoors, you won't need reflective stickers or specialized balls the Mevo Gen2 uses its built-in radar and camera system to track spin and launch data accurately in natural conditions. Once in position, connect the device to the FS Golf app via Wi-Fi to access real-time metrics, shot tracer visuals, and swing video overlays. For the best performance, make sure the area in front of the unit is free of metal objects or electronic interference.
We went into the range test with the goal to compare the carry distance only as there were too many factors that affected data such as total distance.
We hit 20 different shots with three different clubs that range significantly in club speed and typical carry distance: pitching wedge, 6 iron and driver.
We've also tested these other launch monitors at the range:
PITCHING WEDGE
The pitching wedge real life carry distance versus what the Mevo Gen2 registered were nearly identical. The Mevo Gen2 was never off by more than a few yards and the biggest difference we recorded was just 3.5 yards.
The average pitching wedge yardage difference was -0.075 yards or just 0.98%. Take a look at the table below for a shot by shot analysis of the real life carry distance vs. simulator carry distance.
|
Shot
|
Real Life Carry Distance
|
Simulator Carry Distance
|
Yardage Difference
|
Percentage Difference
|
|
Shot 1
|
120 |
119.8 |
0.2 |
0.17% |
|
Shot 2
|
128 |
128.8 |
0.8 |
0.63% |
|
Shot 3
|
127 |
127.4 |
0.4 |
0.31% |
|
Shot 4
|
121 |
121.4 |
0.4 |
0.33% |
|
Shot 5
|
122 |
121.2 |
0.8 |
0.66% |
|
Shot 6
|
113 |
111.9 |
1.1 |
0.97% |
|
Shot 7
|
125 |
124.1 |
0.9 |
0.72% |
|
Shot 8
|
126 |
128 |
2 |
1.59% |
|
Shot 9
|
132 |
129.1 |
2.9 |
2.20% |
|
Shot 10
|
134 |
131.5 |
2.5 |
1.87% |
|
Shot 11
|
135 |
138.5 |
3.5 |
2.59% |
|
Shot 12
|
133 |
132.7 |
0.3 |
0.23% |
|
Shot 13
|
117 |
118 |
1 |
0.85% |
|
Shot 14
|
93 |
95.1 |
2.1 |
2.26% |
|
Shot 15
|
127 |
125.5 |
1.5 |
1.18% |
|
Shot 16
|
118 |
117.7 |
0.3 |
0.25% |
|
Shot 17
|
118 |
119.8 |
1.8 |
1.53% |
|
Shot 18
|
108 |
107.6 |
0.4 |
0.37% |
|
Shot 19
|
123 |
122.7 |
0.3 |
0.24% |
|
Shot 20
|
122 |
122.7 |
0.7 |
0.57% |
| |
|
Average
|
0.075
|
0.98%
|
6 IRON
After finishing up 20 shots with the pitching wedge we wanted to test out a mid iron and settled on hitting 20 shots with the 6-iron.
After a pulled first shot that showed a difference of 7.5 yards, all the shots varied by no more than 5 yards. Almost all of the shots stayed within 0.5-3 yards off.
The average 6-iron difference for carry distance over 20 shots was just .0375 yards or 0.90%. So far the Mevo Gen2 has been the most accurate outdoor launch monitor we have tested.
|
Shot
|
Real Life Carry Distance |
Simulator Carry Distance
|
Yardage Difference
|
Percentage Difference
|
|
Shot 1
|
145
|
137.5
|
7.5
|
5.17%
|
|
Shot 2
|
154
|
154.3
|
0.3
|
0.19%
|
|
Shot 3
|
144
|
144.8
|
0.8
|
0.56%
|
|
Shot 4
|
146
|
144.6
|
1.4
|
0.96%
|
|
Shot 5
|
155
|
153.2
|
1.8
|
1.16%
|
|
Shot 6
|
144
|
142.8
|
1.2
|
0.83%
|
|
Shot 7
|
181
|
179.6
|
1.4
|
0.77%
|
|
Shot 8
|
172
|
169.8
|
2.2
|
1.28%
|
|
Shot 9
|
182
|
185
|
3
|
1.65%
|
|
Shot 10
|
144
|
145
|
1
|
0.69%
|
|
Shot 11
|
168
|
170.2
|
2.2
|
1.31%
|
|
Shot 12
|
187
|
188.1
|
1.1
|
0.59%
|
|
Shot 13
|
130
|
130.6
|
0.6
|
0.46%
|
|
Shot 14
|
120
|
121.3
|
1.3
|
1.08%
|
|
Shot 15
|
195
|
193.3
|
1.7
|
0.87%
|
|
Shot 16
|
178
|
177.4
|
0.6
|
0.34%
|
|
Shot 17
|
191
|
194.5
|
3.5
|
1.83%
|
|
Shot 18
|
141
|
140.7
|
0.3
|
0.21%
|
|
Shot 19
|
183
|
182.6
|
0.4
|
0.22%
|
|
Shot 20
|
170
|
175.1
|
5.1
|
3.00%
|
| |
|
Average
|
0.375
|
0.90%
|
DRIVER
The driver data from the Mevo Gen2 was a little inconsistent. We had relatively little weather interference outside of the occasional breeze. We did have some swirling wind from time to time which could contribute to issues with the Mevo Gen2 tracking the ball.
Even with a few adverse weather conditions, the average yardage difference for the driver was just -4.495 yard which was just 2.10%.
As you take a look at the data below, you will see a wide margin of difference for the first two shots followed by a much closer average between the shots.
|
Shot
|
Real Life Carry Distance
|
Simulator Carry Distance
|
Yardage Difference
|
Percentage Difference
|
|
Shot 1
|
255 |
268.4 |
13.4 |
5.25% |
|
Shot 2
|
267 |
254.1 |
12.9 |
4.83% |
|
Shot 3
|
274 |
278 |
4 |
1.46% |
|
Shot 4
|
261 |
252.4 |
8.6 |
3.30% |
|
Shot 5
|
262 |
270.6 |
8.6 |
3.28% |
|
Shot 6
|
238 |
247.1 |
9.1 |
3.82% |
|
Shot 7
|
251 |
261 |
10 |
3.98% |
|
Shot 8
|
254 |
269.1 |
15.1 |
5.94% |
|
Shot 9
|
259 |
266.1 |
7.1 |
2.74% |
|
Shot 10
|
245 |
242.6 |
2.4 |
0.98% |
|
Shot 11
|
258 |
260.1 |
2.1 |
0.81% |
|
Shot 12
|
248 |
248.1 |
0.1 |
0.04% |
|
Shot 13
|
248 |
248.9 |
0.9 |
0.36% |
|
Shot 14
|
236 |
248.4 |
12.4 |
5.25% |
|
Shot 15
|
251 |
251.2 |
0.2 |
0.08% |
|
Shot 16
|
241 |
247.2 |
6.2 |
2.57% |
|
Shot 17
|
244 |
250.5 |
6.5 |
2.66% |
|
Shot 18
|
254 |
263.2 |
9.2 |
3.62% |
|
Shot 19
|
239 |
239.9 |
0.9 |
0.38% |
|
Shot 20
|
255 |
263 |
8 |
3.14% |
| |
|
Average
|
4.495
|
2.10%
|
Mevo Gen2 OVERALL
Based off the testing we did, it's pretty easy to draw the conclusion that the Mevo Gen2 shines outdoors on the range. With an overall average yardage distance of just -0.881 or 1.33% it comes in as the most accurate launch monitor we have ever tested on the range.
The Mevo Gen2 offers solid accuracy and some awesome features that you can only get on much more expensive launch monitors.


