SkyTrak has long been known as one of the most popular launch monitor brands for indoor golf. But how accurate are SkyTrak launch monitors, and what affects the numbers you see on screen?
We test the SkyTrak models in real-world conditions at Carl’s Place, both indoors and outdoors, to better understand how accuracy holds up across different setups. Here’s what golfers should know.
SkyTrak Models at a Glance
SkyTrak has released multiple launch monitor models over the years. While the technology has evolved, the goal has always stayed the same: deliver reliable shot data for home practice.
|
Model |
Tracking Tech |
What to Know |
|
SkyTrak MAX |
Camera-based tracking |
Newest model with faster processing, improved connectivity, and more stable performance indoors. |
|
SkyTrak+ |
Camera plus radar |
Adds Doppler radar for club data and improved shot capture compared to the original SkyTrak. |
|
SkyTrak |
Camera-based tracking |
Proven indoor accuracy, but now discontinued and more sensitive to outdoor lighting conditions. |

Accuracy is what turns practice into progress. When your launch monitor data matches real-world performance, you can trust your numbers and make smarter adjustments to your swing.
How Carl's Place Tests Launch Monitor Accuracy
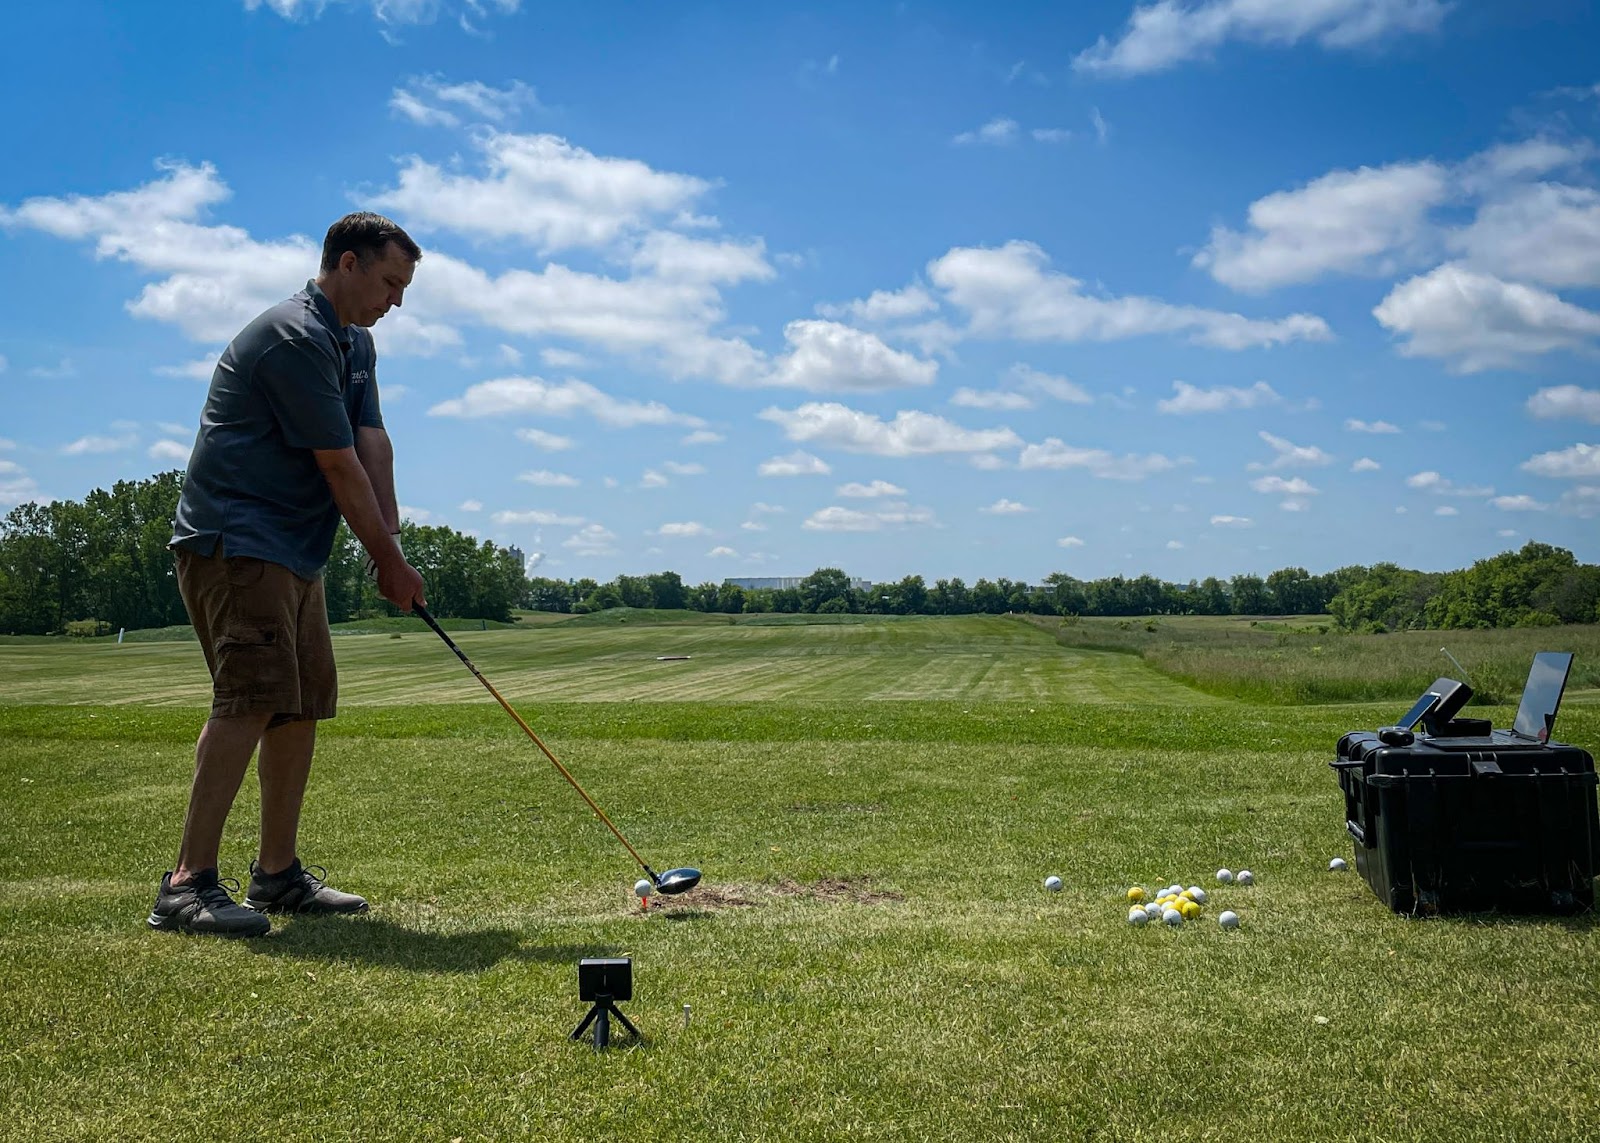
Our team of product testers work with launch monitors in controlled indoor setups and real outdoor environments. We compare simulator carry distances to actual measured distances using rangefinders (we focus primarily on carry distance since total distance is heavily affected by wind, turf, and terrain). We test outdoors across multiple clubs to see how consistency holds up throughout the bag.
Carl's Place also has a dedicated space for indoor golf simulators where we test products, film content, and have visitors. Want to visit? These extensive product testing areas give Carl's Place a leg up in the industry for golf simulator product knowledge.
SkyTrak MAX Accuracy
SkyTrak MAX is designed to offer faster processing, improved connectivity, and more reliable shot capture compared to previous generations. While we have not completed a full MAX-specific outdoor test yet, it is built on the most advanced hardware SkyTrak has released.
Golfers using MAX can expect the most stable experience indoors, especially in well-lit, controlled environments.
SkyTrak+ Accuracy
SkyTrak+ added Doppler radar to SkyTrak’s photometric camera system, allowing it to measure both ball and club data. This improved shot capture and expanded the data golfers could see during practice.
Our testing showed improved consistency indoors, with more stable readings across irons and wedges. Outdoor performance improved compared to the original SkyTrak, but environmental factors still played a role.
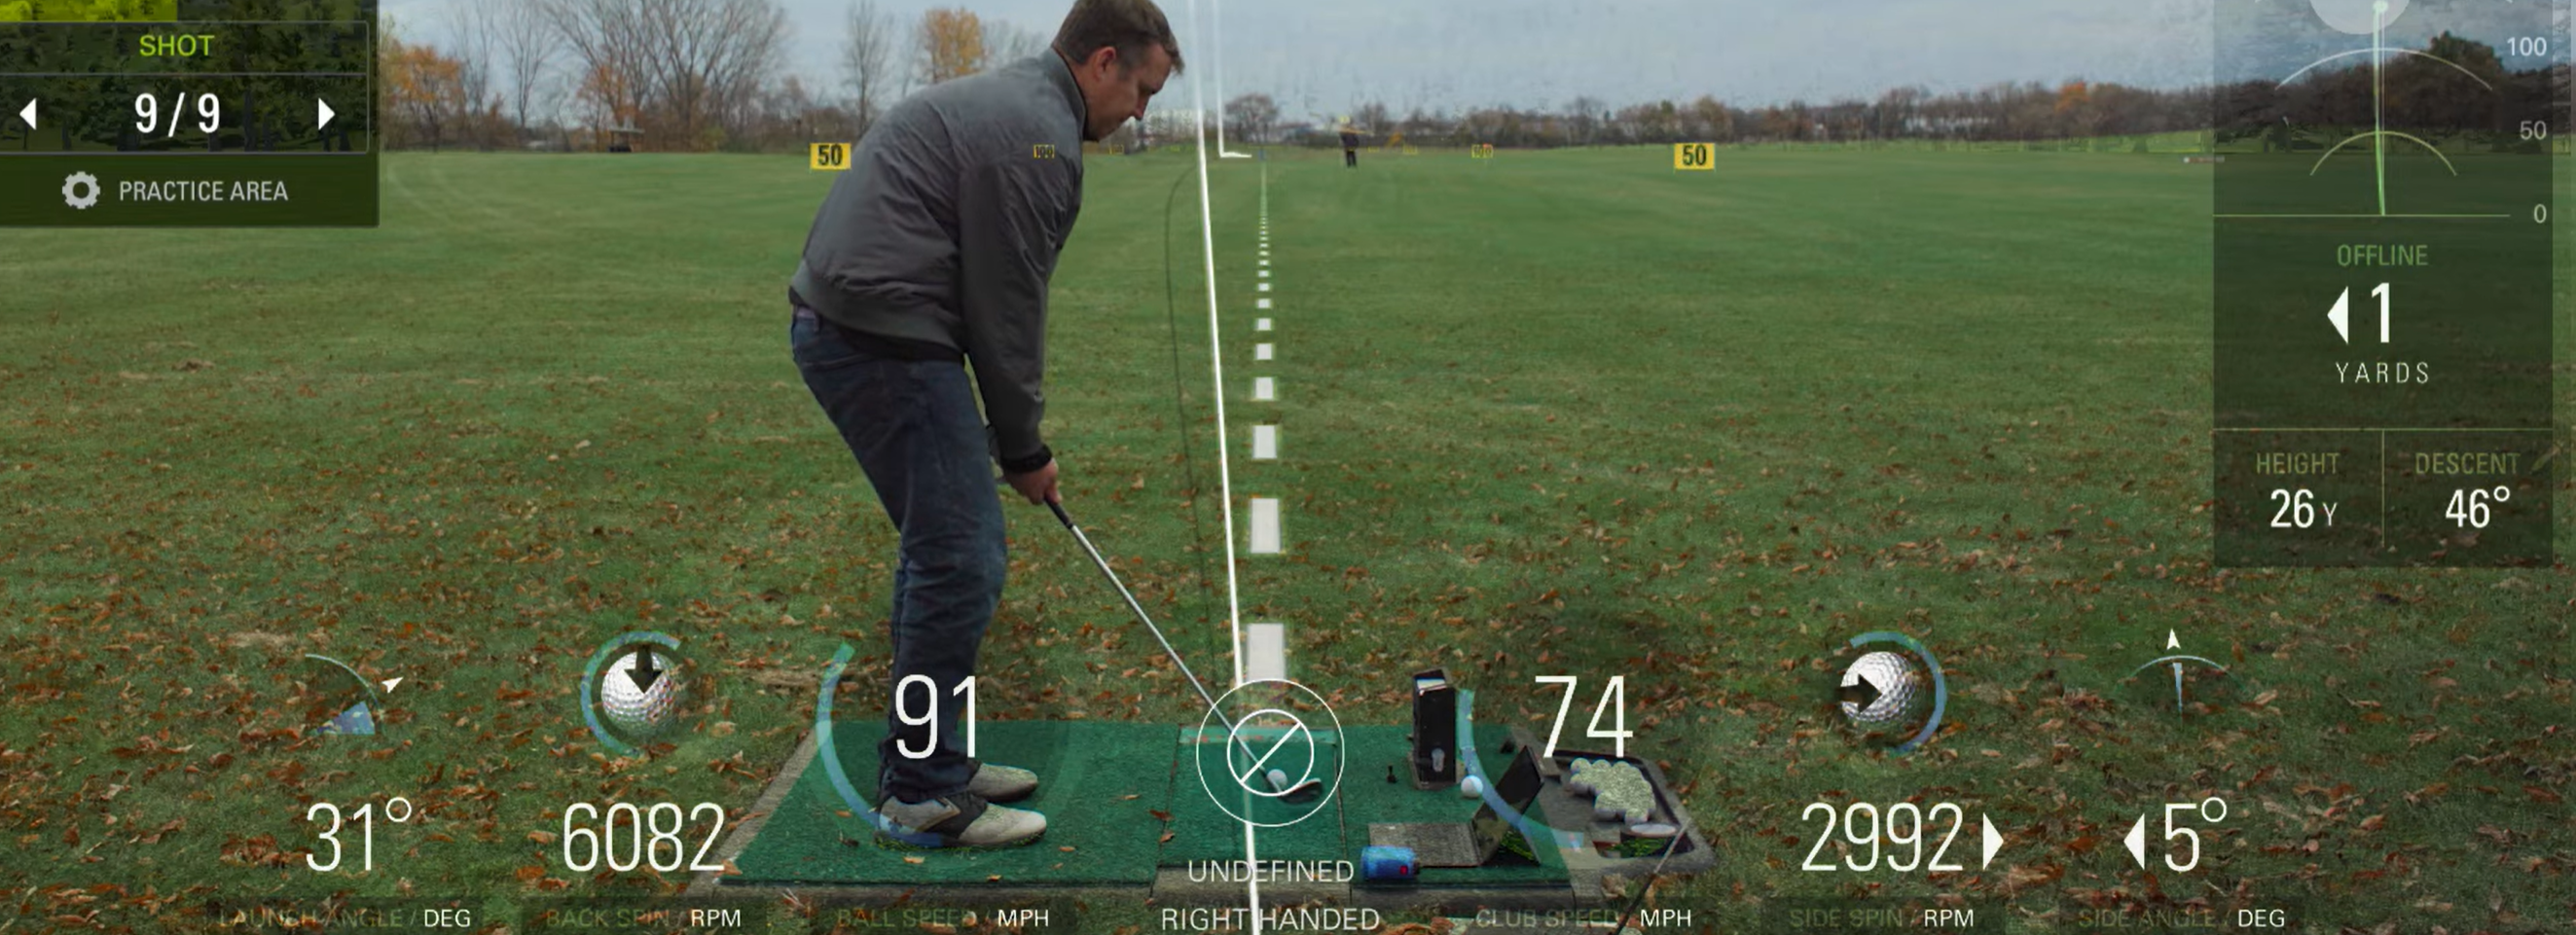
As with all our tests, we have Tim from our customer service team take 20 shots with a driver, 6 iron and pitching wedge. Mike from the marketing team is out in the field tracking down and marking the carry distance of each shot. Tim then uses a rangefinder to measure the distance to Mike’s marked ball location and compares it to the launch monitor number.
Keep in mind, there are a range of factors that can affect numbers at the driving range. Those factors include: weather, an elevated tee area, and human error on the ball spotting.
DRIVER Accuracy with SkyTrak+
With just about every launch monitor test we’ve done, driver data has shown the most variance. No difference here with the SkyTrak+. The first 11 shots or so were somewhat inconsistent, but then it dialed in and was pretty darn accurate.
The last 9 shots were all within 6 yards of the real life number, which helped bring the average yardage difference to just under 10 yards, which was 4.38% off. Overall, not too bad, especially for the higher club and ball speeds from a driver.
|
Shot |
Real Life Carry Distance |
Simulator Carry Distance |
Yardage Difference |
Percentage Difference |
|
Shot 1 |
220 |
233 |
13 |
5.91% |
|
Shot 2 |
243 |
213 |
30 |
12.35% |
|
Shot 3 |
215 |
212 |
3 |
1.40% |
|
Shot 4 |
239 |
252 |
13 |
5.44% |
|
Shot 5 |
242 |
235 |
7 |
2.89% |
|
Shot 6 |
242 |
249 |
7 |
2.89% |
|
Shot 7 |
232 |
220 |
12 |
5.17% |
|
Shot 8 |
232 |
221 |
11 |
4.74% |
|
Shot 9 |
213 |
176 |
37 |
17.37% |
|
Shot 10 |
216 |
201 |
15 |
6.94% |
|
Shot 11 |
215 |
236 |
21 |
9.77% |
|
Shot 12 |
232 |
238 |
6 |
2.59% |
|
Shot 13 |
249 |
247 |
2 |
0.80% |
|
Shot 14 |
241 |
242 |
1 |
0.41% |
|
Shot 15 |
212 |
214 |
2 |
0.94% |
|
Shot 16 |
233 |
235 |
2 |
0.86% |
|
Shot 17 |
248 |
244 |
4 |
1.61% |
|
Shot 18 |
241 |
242 |
1 |
0.41% |
|
Shot 19 |
234 |
229 |
5 |
2.14% |
|
Shot 20 |
205 |
199 |
6 |
2.93% |
|
Average |
9.9 |
4.38% |
6 IRON Accuracy with SkyTrak+
Tim’s 6 iron wielded some different results than the driver.
Just two shots were more than 10 yards off, and the rest were within 7 yards of the real life distance.
That added up to be 4.5 yards different on average, or an impressive 2.52%.
|
Shot |
Real Life Carry Distance |
Simulator Carry Distance |
Yardage Difference |
Percentage Difference |
|
Shot 1 |
174 |
178 |
4 |
2.30% |
|
Shot 2 |
190 |
185 |
5 |
2.63% |
|
Shot 3 |
184 |
159 |
25 |
13.59% |
|
Shot 4 |
184 |
186 |
2 |
1.09% |
|
Shot 5 |
144 |
142 |
2 |
1.39% |
|
Shot 6 |
169 |
174 |
5 |
2.96% |
|
Shot 7 |
181 |
192 |
11 |
6.08% |
|
Shot 8 |
182 |
184 |
2 |
1.10% |
|
Shot 9 |
170 |
173 |
3 |
1.76% |
|
Shot 10 |
180 |
180 |
0 |
0.00% |
|
Shot 11 |
182 |
186 |
4 |
2.20% |
|
Shot 12 |
166 |
169 |
3 |
1.81% |
|
Shot 13 |
199 |
203 |
4 |
2.01% |
|
Shot 14 |
176 |
183 |
7 |
3.98% |
|
Shot 15 |
189 |
190 |
1 |
0.53% |
|
Shot 16 |
194 |
195 |
1 |
0.52% |
|
Shot 17 |
171 |
177 |
6 |
3.51% |
|
Shot 18 |
173 |
172 |
1 |
0.58% |
|
Shot 19 |
179 |
182 |
3 |
1.68% |
|
Shot 20 |
157 |
156 |
1 |
0.64% |
|
Average |
4.5 |
2.52% |
PITCHING WEDGE Accuracy with SkyTrak+
Although not as strong as the 6 iron data, the numbers for the pitching wedge were also pretty solid. Only one shot was more than 10 yards off.
The other 19 shots were all within 7 yards, which helped the average yardage difference be just 3.95, or 3.5%.
|
Shot |
Real Life Carry Distance |
Simulator Carry Distance |
Yardage Difference |
Percentage Difference |
|
Shot 1 |
128 |
125 |
3 |
2.34% |
|
Shot 2 |
118 |
118 |
0 |
0.00% |
|
Shot 3 |
122 |
119 |
3 |
2.46% |
|
Shot 4 |
111 |
116 |
5 |
4.50% |
|
Shot 5 |
120 |
113 |
7 |
5.83% |
|
Shot 6 |
94 |
91 |
3 |
3.19% |
|
Shot 7 |
131 |
130 |
1 |
0.76% |
|
Shot 8 |
123 |
122 |
1 |
0.81% |
|
Shot 9 |
114 |
120 |
6 |
5.26% |
|
Shot 10 |
112 |
114 |
2 |
1.79% |
|
Shot 11 |
109 |
109 |
0 |
0.00% |
|
Shot 12 |
117 |
105 |
12 |
10.26% |
|
Shot 13 |
122 |
120 |
2 |
1.64% |
|
Shot 14 |
113 |
110 |
3 |
2.65% |
|
Shot 15 |
105 |
110 |
5 |
4.76% |
|
Shot 16 |
109 |
116 |
7 |
6.42% |
|
Shot 17 |
106 |
109 |
3 |
2.83% |
|
Shot 18 |
113 |
119 |
6 |
5.31% |
|
Shot 19 |
107 |
112 |
5 |
4.67% |
|
Shot 20 |
110 |
115 |
5 |
4.55% |
|
Average |
3.95 |
3.50% |
When comparing the accuracy tests of the SkyTrak+ and original SkyTrak, you’ll see the company did a great job of increasing its accuracy and making it an even better value for its price point.
Getting this accuracy - an average of 3.47% off amongst the 60 shots - and the new data points the SkyTrak+ provides is hard to beat at its affordable price.

SkyTrak Accuracy
The original SkyTrak built its reputation as a reliable indoor launch monitor. While it struggled outdoors in certain lighting conditions, it delivered dependable carry distance data for indoor practice setups.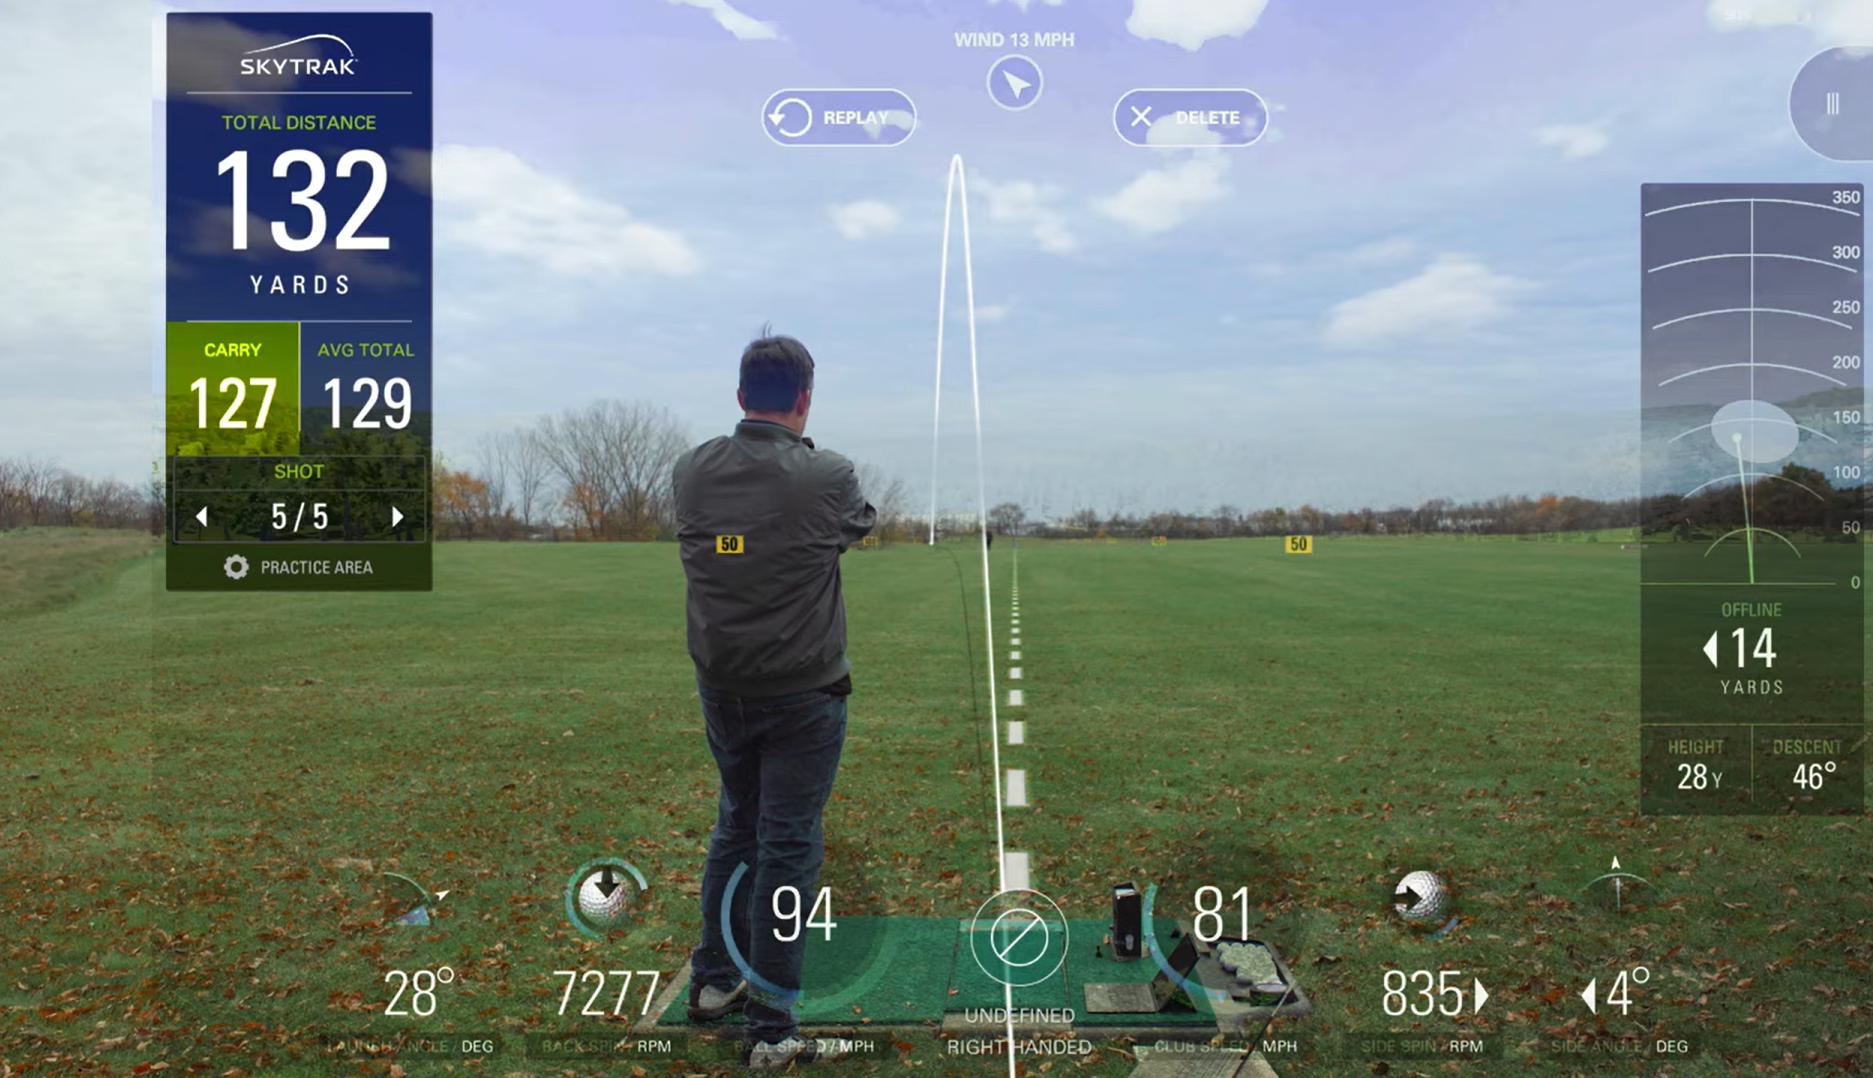
Most accuracy issues outdoors came from sunlight interference and uneven hitting surfaces, not the unit itself.
EDITOR'S NOTE: The original SkyTrak launch monitor featured in this piece has been discontinued.
PITCHING WEDGE Accuracy with SkyTrak
Tim started the day with 20 shots with his pitching wedge, where the SkyTrak performed pretty well.
As you can see in the table below, the simulator carry distance was never less than the actual carry distance. It was a breezy day at the range, and although we plugged in all the weather data into the SkyTrak app, the app could measure the wind effect on the ball differently than what it was in real life. After all, when it’s breezy one minute and calm the next in real life, it would be hard for the simulator to know that.
But overall, the pitching wedge was on average within 6.82 percent of the actual carry distance in real life. Not too shabby.
| Shot | Real Life Carry Distance | Simulator Carry Distance | Yardage Difference | % Difference |
| Shot 1 | 100 | 105 | 5 | 5.00% |
| Shot 2 | 105 | 122 | 17 | 16.19% |
| Shot 3 | 112 | 112 | 0 | 0.00% |
| Shot 4 | 122 | 127 | 5 | 4.10% |
| Shot 5 | 102 | 113 | 11 | 10.78% |
| Shot 6 | 107 | 115 | 8 | 7.48% |
| Shot 7 | 98 | 110 | 12 | 12.24% |
| Shot 8 | 107 | 117 | 10 | 9.35% |
| Shot 9 | 107 | 119 | 12 | 11.21% |
| Shot 10 | 97 | 99 | 2 | 2.06% |
| Shot 11 | 95 | 103 | 8 | 8.42% |
| Shot 12 | 107 | 107 | 0 | 0.00% |
| Shot 13 | 102 | 103 | 1 | 0.98% |
| Shot 14 | 119 | 135 | 16 | 13.45% |
| Shot 15 | 110 | 118 | 8 | 7.27% |
| Shot 16 | 109 | 116 | 7 | 6.42% |
| Shot 17 | 99 | 106 | 7 | 7.07% |
| Shot 18 | 99 | 101 | 2 | 2.02% |
| Shot 19 | 109 | 113 | 4 | 3.67% |
| Shot 20 | 115 | 125 | 10 | 8.70% |
| Average | 7.25 | 6.82% |
6 IRON Accuracy with SkyTrak
As you will see below, the 6 iron didn’t perform quite as well as the pitching wedge. However, there are many factors that could have contributed to that, including the weather, human error in marking the spot in the field, and so on.
A majority of the shots stayed within 15 yards of the actual carry distance, which is respectable. Some were well over 15 yards different, including one at 42 yards, which seemed to be just a complete misread and we aren’t exactly sure why or how.
This time, it was a mixed bag of whether the carry distance would be longer in real life or on the simulator. On average, though, it was about 10 percent different.
| Shot | Real Life Carry Distance | Simulator Carry Distance | Yardage Difference | % Difference |
| Shot 1 | 147 | 165 | 18 | 12.24% |
| Shot 2 | 140 | 144 | 4 | 2.86% |
| Shot 3 | 160 | 175 | 15 | 9.38% |
| Shot 4 | 160 | 202 | 42 | 26.25% |
| Shot 5 | 147 | 157 | 10 | 6.80% |
| Shot 6 | 165 | 172 | 7 | 4.24% |
| Shot 7 | 140 | 145 | 5 | 3.57% |
| Shot 8 | 152 | 168 | 16 | 10.53% |
| Shot 9 | 146 | 155 | 9 | 6.16% |
| Shot 10 | 140 | 149 | 9 | 6.43% |
| Shot 11 | 160 | 183 | 23 | 14.38% |
| Shot 12 | 152 | 184 | 32 | 21.05% |
| Shot 13 | 143 | 149 | 6 | 4.20% |
| Shot 14 | 136 | 145 | 9 | 6.62% |
| Shot 15 | 128 | 133 | 5 | 3.91% |
| Shot 16 | 140 | 161 | 21 | 15.00% |
| Shot 17 | 141 | 166 | 25 | 17.73% |
| Shot 18 | 160 | 187 | 27 | 16.88% |
| Shot 19 | 144 | 154 | 10 | 6.94% |
| Shot 20 | 136 | 143 | 7 | 5.15% |
| Average | 15 | 10.02% |
DRIVER Accuracy with SkyTrak
Last was the driver, which Tim has admitted is not his most consistent club. Sometimes he missed his aiming point left and other times he missed right. But who doesn’t?
Marking the driver shots in the field was definitely the most difficult for Mike as there was a lot of squinting and exercise involved. However, the data shows that the carry distances were just 4.27 percent different.
Again, it was a mixed bag as to if the real life or simulator carry distance would be longer, but only four shots were more than 15 yards different. Check out the data below.
| Driver | Real Life Carry Distance | Simulator Carry Distance | Yardage Difference | % Difference |
| Shot 1 | 195 | 196 | 1 | 0.51% |
| Shot 2 | 200 | 185 | 15 | 7.50% |
| Shot 3 | 240 | 231 | 9 | 3.75% |
| Shot 4 | 203 | 191 | 12 | 5.91% |
| Shot 5 | 214 | 222 | 8 | 3.74% |
| Shot 6 | 218 | 211 | 7 | 3.21% |
| Shot 7 | 208 | 224 | 16 | 7.69% |
| Shot 8 | 207 | 203 | 4 | 1.93% |
| Shot 9 | 204 | 205 | 1 | 0.49% |
| Shot 10 | 218 | 210 | 8 | 3.67% |
| Shot 11 | 223 | 223 | 0 | 0.00% |
| Shot 12 | 206 | 196 | 10 | 4.85% |
| Shot 13 | 220 | 220 | 0 | 0.00% |
| Shot 14 | 200 | 194 | 6 | 3.00% |
| Shot 15 | 238 | 235 | 3 | 1.26% |
| Shot 16 | 208 | 227 | 19 | 9.13% |
| Shot 17 | 178 | 207 | 29 | 16.29% |
| Shot 18 | 220 | 238 | 18 | 8.18% |
| Shot 19 | 208 | 208 | 0 | 0.00% |
| Shot 20 | 215 | 224 | 9 | 4.19% |
| Average | 8.75 | 4.27% |
SkyTrak Accuracy Test Overall
When looking at the 60 shots overall, the average difference was just more than 10 yards, or 7 percent. Overall, not too shabby despite the few shots that were significantly different.
“It is a good launch monitor under the correct conditions,” Tim said. “Sunlight will definitely affect the unit being able to register a shot. Our initial attempt at doing testing did not work well. I think the issues with shot data being inaccurate could come from human error, and possibly weather conditions affecting ball flight.”
Although the SkyTrak launch monitor is portable and easy to bring with you to the range, it does not seem to perform as well outside as it does inside. That said, take into account that there might be some variation with your indoor numbers as well, but overall, it’s a great golf launch monitor for the price.
What Affects Launch Monitor Accuracy Outdoors
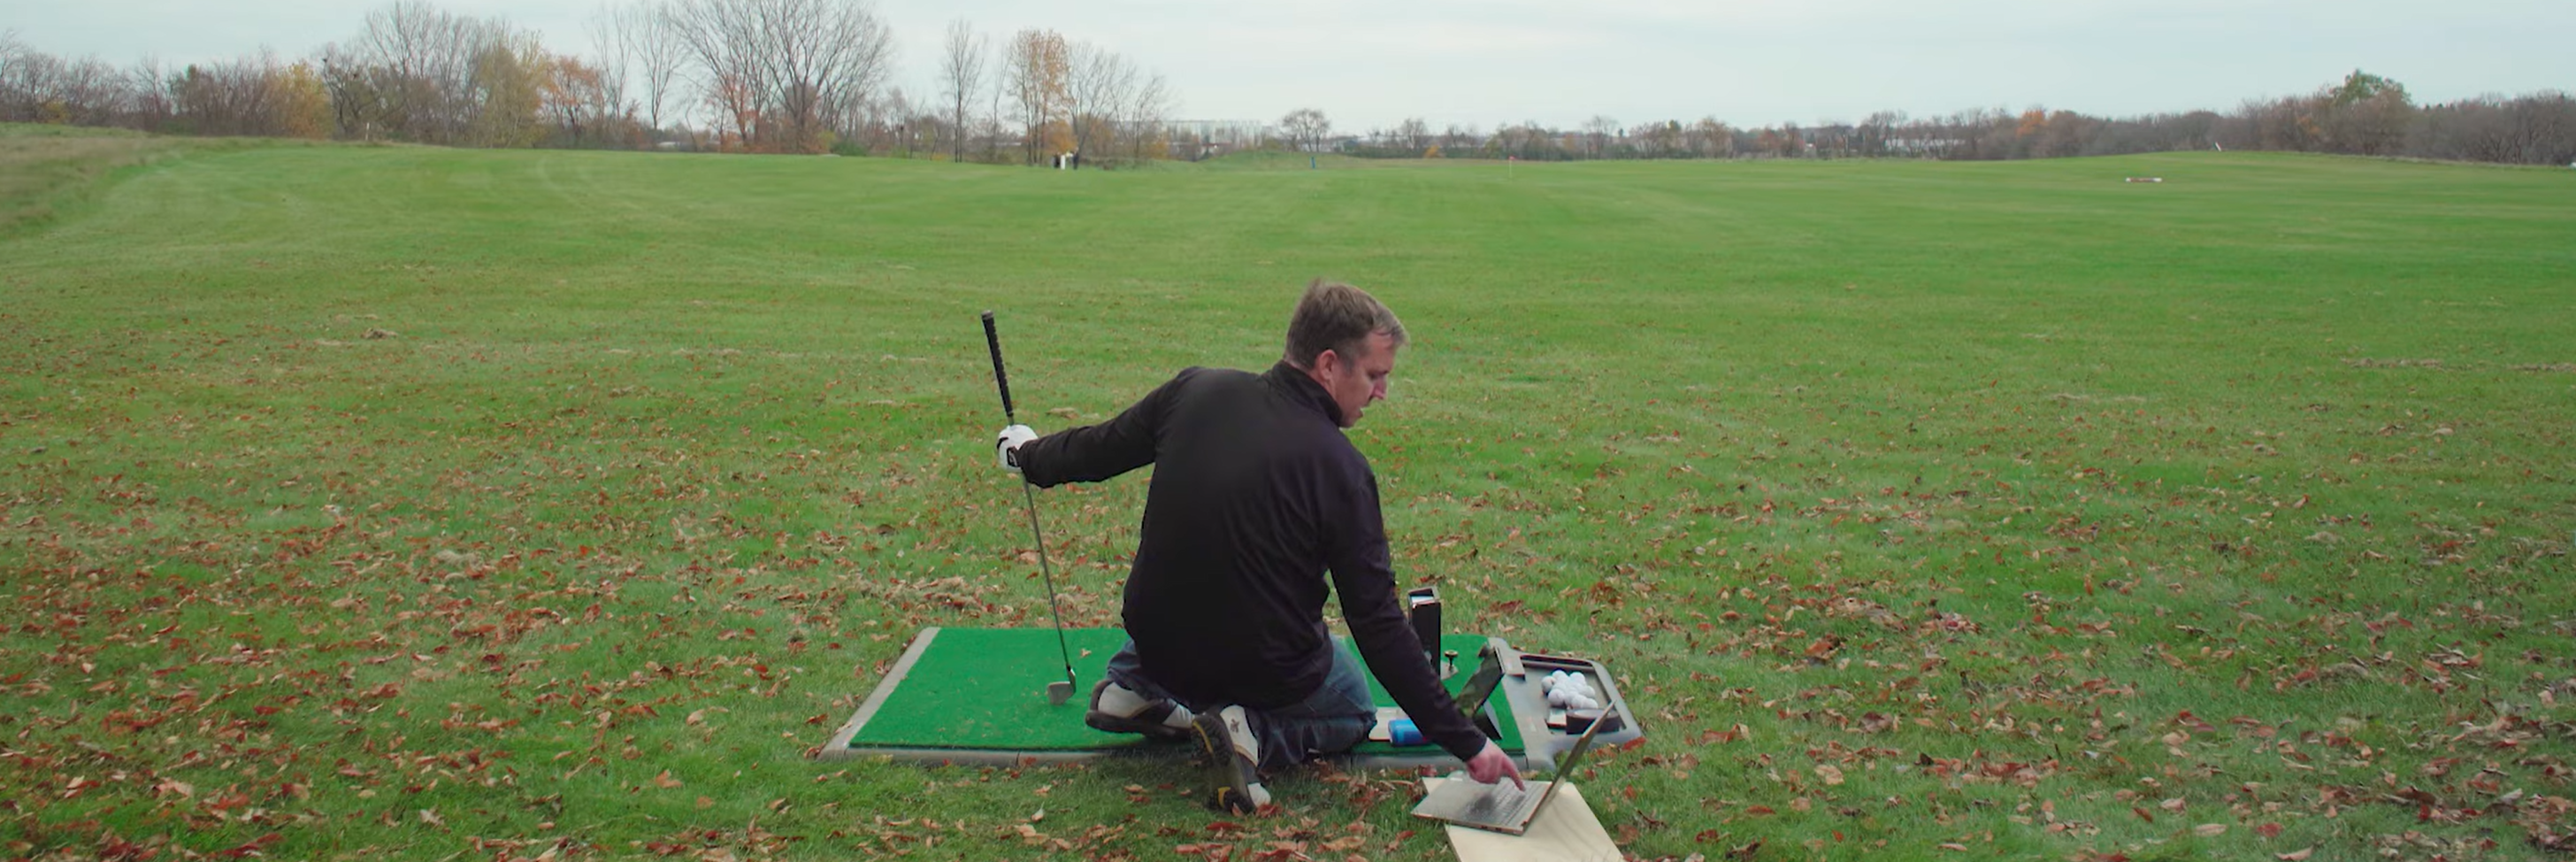
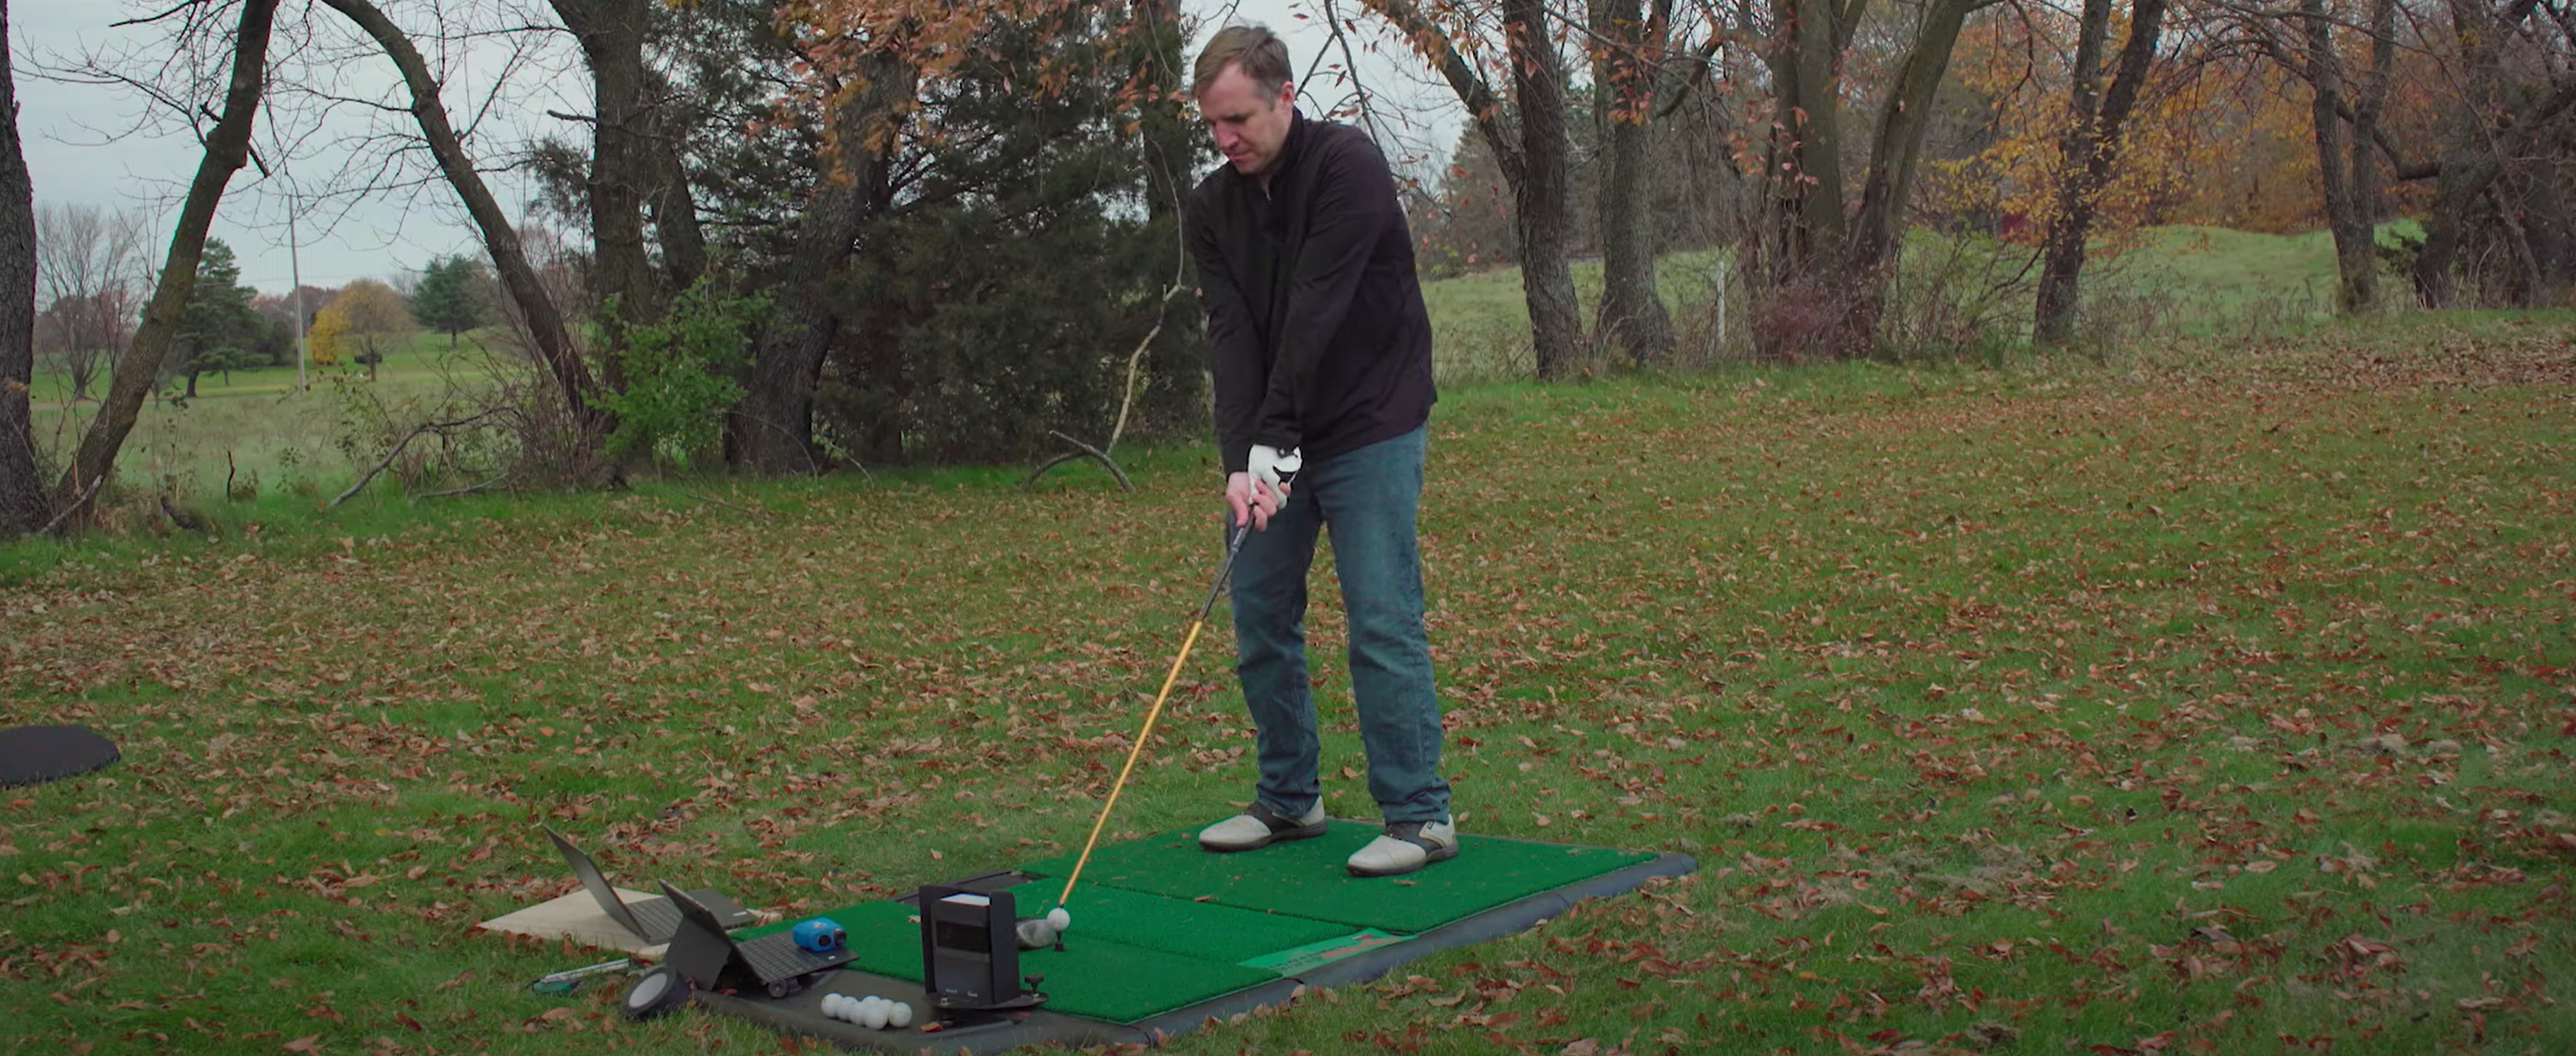
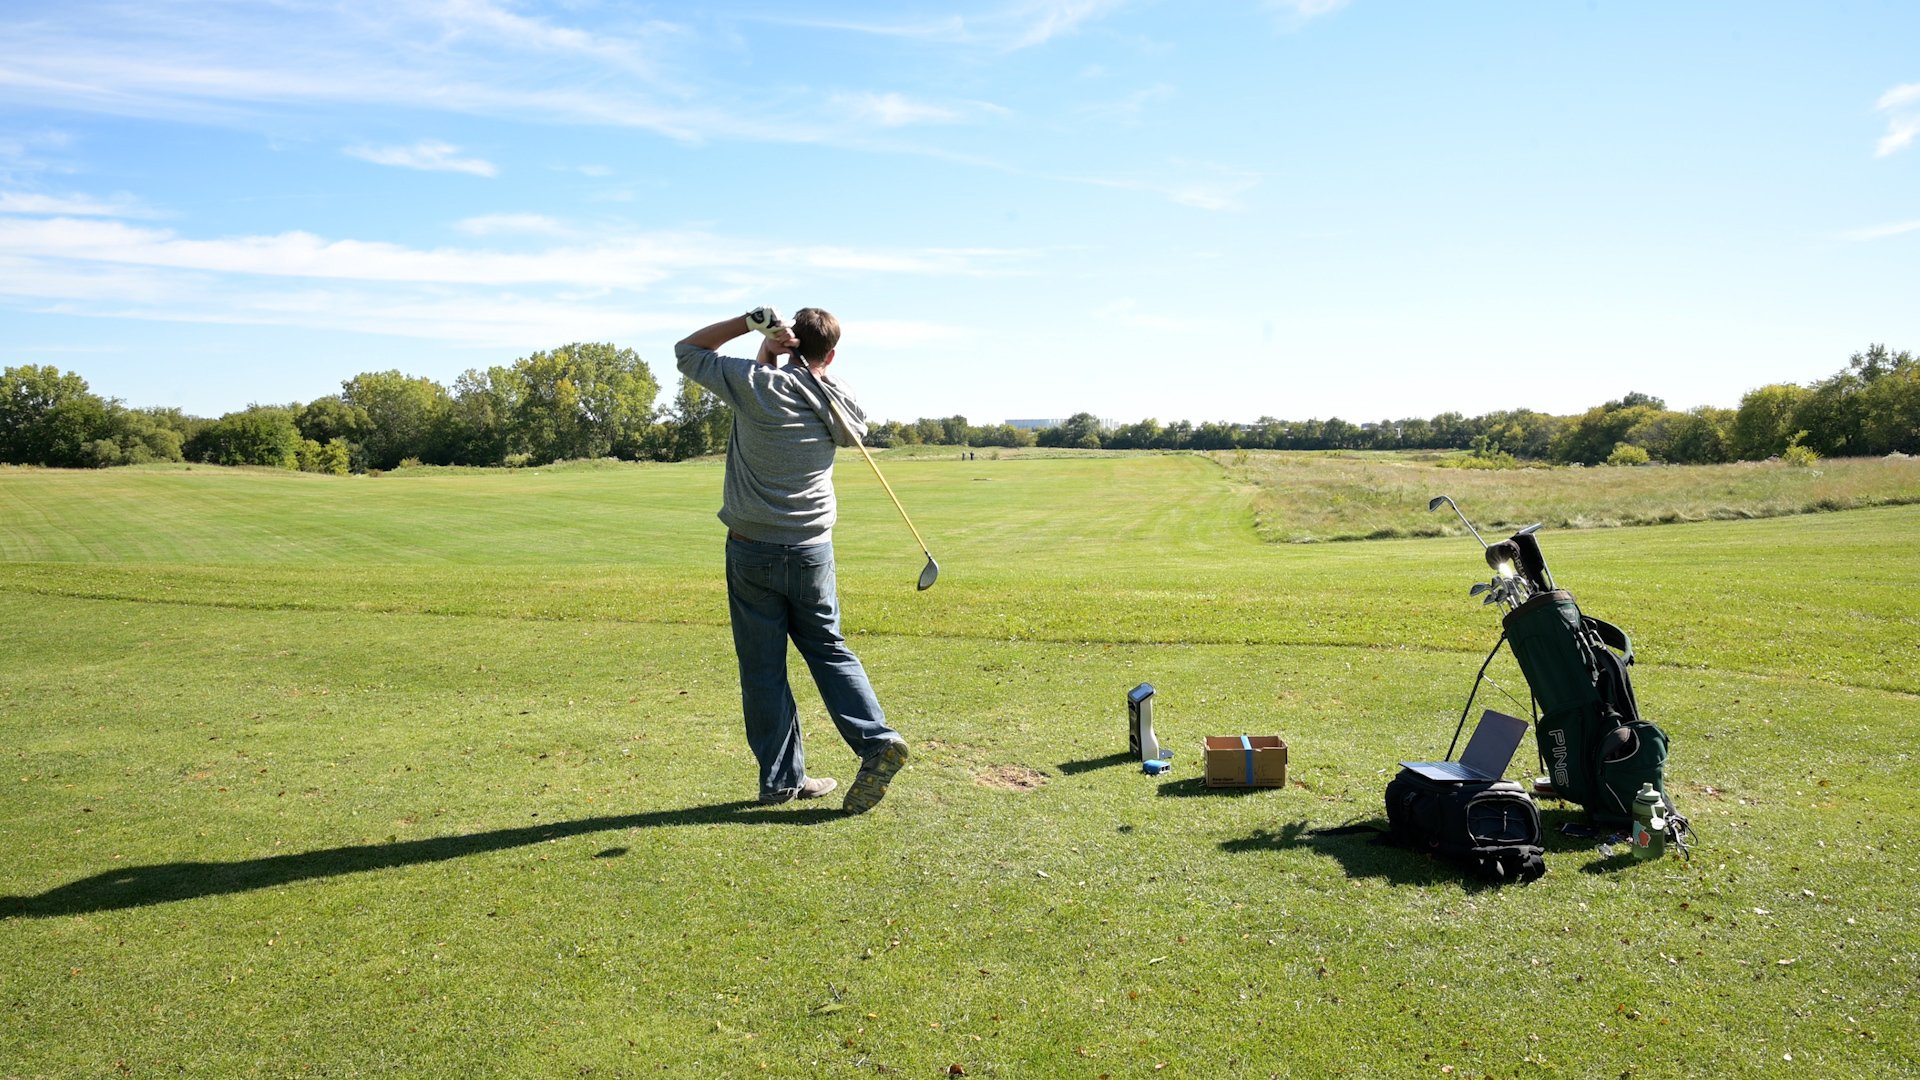
Outdoor testing is a little less predictable than indoor setups. Sunlight, wind, and uneven ground can all impact how the ball is read. When we test outside, one golfer hits while another tracks the ball with a rangefinder downrange. Even with careful setup, factors like wind and landing conditions can create small differences between measured carry and what the unit reports.
Want to see more of our outdoor launch monitor testing videos?
What Affects SkyTrak Accuracy Indoors
Several setup factors play a big role in how accurate your SkyTrak readings are.
- Lighting conditions
- Ball placement
- Level hitting surface
- Stable Wi-Fi connection
- Indoor vs outdoor environment
Indoor spaces with consistent lighting and a flat mat provide the best results. Outdoor setups introduce more variables that can impact shot capture.
|
|
Is SkyTrak Accurate Enough for Real Improvement
For most golfers, all SkyTrak brand launch monitors provides more than enough accuracy to track progress, dial in distances, and build confidence with their clubs.
While they may not match tour-level launch monitors, the consistency and affordability make SkyTrak a strong choice for home practice.
If you are still comparing options, our full breakdown of different launch monitor types and testing can be found in our Choosing a Launch Monitor guide.
Final Takeaways
SkyTrak remains one of the most trusted launch monitors for indoor golf. With proper setup and realistic expectations, it delivers reliable performance for golfers looking to improve at home.
Newer models like SkyTrak MAX continue to build on that foundation with improved hardware and connectivity.
FAQs
How accurate is SkyTrak?
SkyTrak provides reliable carry distance accuracy, especially indoors. In our SkyTrak+ outdoor testing, the average difference across 60 shots was 3.47%, with irons and wedges showing the most consistent results.
Is SkyTrak accurate indoors?
Yes. SkyTrak is most accurate indoors, where lighting, ball placement, and hitting surfaces are controlled.
Is SkyTrak accurate outdoors?
Yes, but outdoor accuracy depends on lighting and conditions. In our SkyTrak+ outdoor tests, most shots were within a few yards of the real carry distance.
Why does my SkyTrak distance look shorter than my range distance?
Driving range distances are affected by wind, elevation, and range balls. SkyTrak measures carry distance based on ball flight data, which often appears shorter than total distance at the range.
Why does my shot shape look different indoors?
Indoor swings can change due to space awareness and alignment. Proper setup and leveling help keep shot direction readings accurate.
Does lighting affect SkyTrak accuracy?
Yes. Even lighting improves shot capture accuracy, especially for camera-based tracking systems.
Should the SkyTrak sit on my hitting mat?
Yes. The unit and ball should be on the same level surface. A stable mat helps maintain consistent alignment.
Why do my ball speed and carry numbers feel different from other monitors?
Different launch monitors use different tracking technology and data models. Consistent trends matter more than exact number matches.
How can I improve my SkyTrak accuracy?
For the most accurate SkyTrak readings, make sure the unit is level with your hitting surface, aligned with your target line, placed the correct distance from the ball, and used in good lighting. Consistent ball placement and a stable mat also help improve accuracy.
Search articles by tag:
SkyTrakRelated Posts
Golf Simulators, Launch Monitors, Garmin
Garmin Approach R10 Review: Accuracy Test at the Driving Range

Golf Simulators, Launch Monitors, Garmin
Reviewing the Garmin Approach R50
Launch Monitors, Foresight Sports
GCQuad Review - A Real Outdoor Field Test