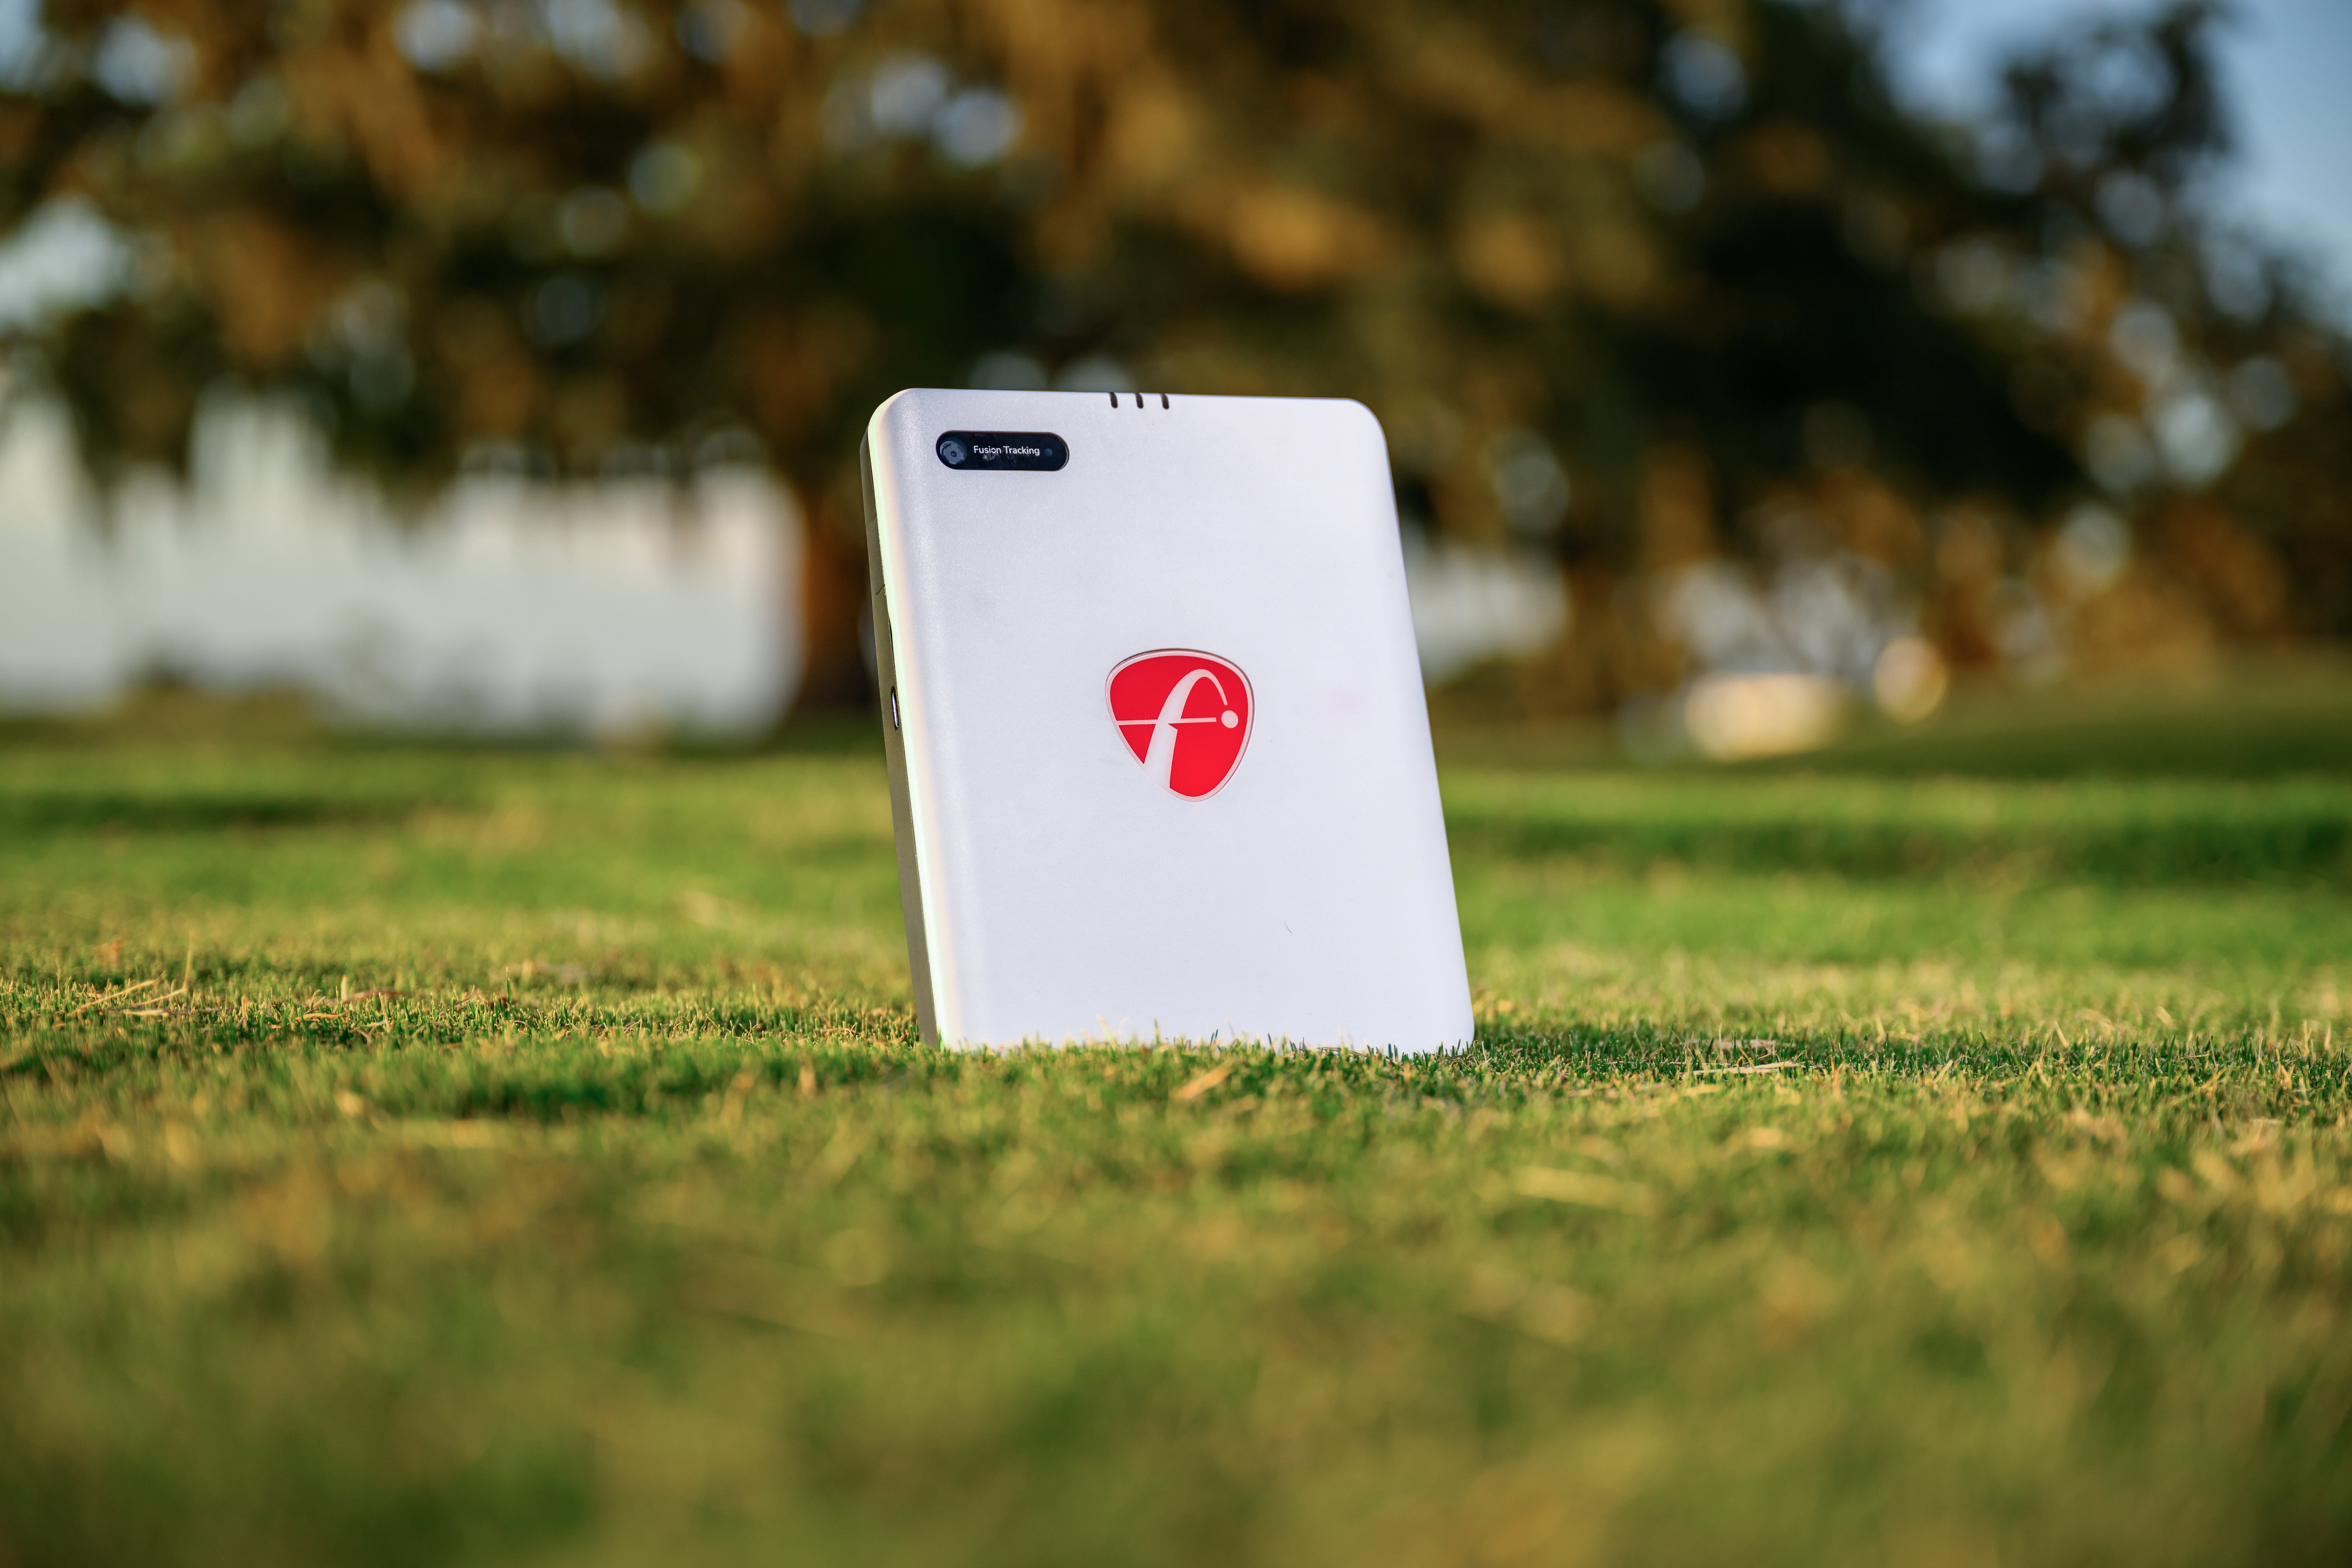
Testing for accuracy, the Carl's Place team compared real-life data at the driving range with numbers from the NVISAGE NEO-E launch monitor.
NVISAGE’s new NEO-E launch monitor promises pro-level accuracy in a rugged, portable design with no subscription fees, so we decided to take it out for a real-world spin and see how it stacks up against on-course data.
We set up at our unofficial “testing facility,” Carl’s Backyard in Milton, Wisconsin, to see how the NEO-E performed.
Setting up the NEO-E is quick and straightforward. Place the unit directly behind the golf ball at the recommended distance, make sure it’s level, and align it with your target line. Because the NEO-E sits behind the golfer and uses its built-in radar and camera tracking, you don’t need reflective stickers or special balls to get accurate spin and launch measurements outdoors. Once positioned, connect it to the MURLIE platform on your phone or tablet via Wi-Fi to see real-time metrics, shot tracer visuals, and swing data overlays. For best performance, keep the space in front of the unit clear of metal objects or electronics that could interfere with the signal.
For our range test, we focused on carry distance since total distance can be affected by too many outside factors. We hit 20 shots each with three clubs of varying speed and carry: a pitching wedge, 6-iron, and driver to see how well the NEO-E handled different swings and ball flights.
We've also tested these other launch monitors at the range:
DRIVER
The driver real life carry distance versus what the NEO-E registered was a little varied but overall relatively consistent. The NEO-E was off by a few yards on a few shots and the biggest difference we recorded was 20 yards.
The average Driver yardage difference was 8.8 yards or 4.24%. Take a look at the table below for a shot by shot analysis of the real life carry distance vs. NEO-E carry distance.
|
Shot
|
Real Life Carry Distance
|
Simulator Carry Distance
|
Yardage Difference
|
Percentage Difference
|
|
Shot 1
|
226 |
220 |
6 |
2.65% |
|
Shot 2
|
219 |
210 |
9 |
4.11% |
|
Shot 3
|
219 |
214 |
5 |
2.28% |
|
Shot 4
|
210 |
214 |
4 |
1.90% |
|
Shot 5
|
209 |
217 |
8 |
3.83% |
|
Shot 6
|
226 |
237 |
11 |
4.87% |
|
Shot 7
|
222 |
235 |
13 |
5.86% |
|
Shot 8
|
208 |
189 |
19 |
9.13% |
|
Shot 9
|
215 |
217 |
2 |
0.93% |
|
Shot 10
|
229 |
218 |
11 |
4.80% |
|
Shot 11
|
235 |
232 |
3 |
1.28% |
|
Shot 12
|
216 |
198 |
18 |
8.33% |
|
Shot 13
|
241 |
237 |
4 |
1.66% |
|
Shot 14
|
239 |
228 |
11 |
4.60% |
|
Shot 15
|
225 |
234 |
9 |
4.00% |
|
Shot 16
|
234 |
236 |
2 |
0.85% |
|
Shot 17
|
222 |
238 |
16 |
7.21% |
|
Shot 18
|
184 |
164 |
20 |
10.87% |
|
Shot 19
|
234 |
231 |
3 |
1.28% |
|
Shot 20
|
186 |
184 |
2 |
4.30% |
| |
|
Average
|
8.8
|
4.24%
|
6 IRON
After finishing up 20 shots with the driver we wanted to test out a mid iron and settled on hitting 20 shots with the 6-iron.
The average 6-iron difference for carry distance over 20 shots was 7.58 yards or 4.49%. Take a look at the table below for all the 6-iron data.
|
Shot
|
Real Life Carry Distance |
Simulator Carry Distance
|
Yardage Difference
|
Percentage Difference
|
|
Shot 1
|
172 |
174 |
2 |
1.16% |
|
Shot 2
|
163 |
173 |
10 |
6.13% |
|
Shot 3
|
184 |
190 |
6 |
3.26% |
|
Shot 4
|
178 |
189 |
11 |
6.18% |
|
Shot 5
|
150 |
151 |
1 |
0.67% |
|
Shot 6
|
164 |
176 |
12 |
7.32% |
|
Shot 7
|
167 |
177 |
10 |
5.99% |
|
Shot 8
|
180 |
192 |
12 |
6.67% |
|
Shot 9
|
164 |
181 |
17 |
10.37% |
|
Shot 10
|
174 |
184 |
10 |
5.75% |
|
Shot 11
|
189 |
191.6 |
2.6 |
1.38% |
|
Shot 12
|
165 |
168.9 |
3.9 |
2.36% |
|
Shot 13
|
166 |
178 |
12 |
7.23% |
|
Shot 14
|
177 |
189.8 |
12.8 |
7.23% |
|
Shot 15
|
171 |
180.1 |
9.1 |
5.32% |
|
Shot 16
|
146 |
152.7 |
6.7 |
4.59% |
|
Shot 17
|
159 |
167 |
8 |
5.03% |
|
Shot 18
|
179 |
181.6 |
2.6 |
1.45% |
|
Shot 19
|
165 |
163.6 |
1.4 |
0.85% |
|
Shot 20
|
166 |
167.5 |
1.5 |
0.90% |
| |
|
Average
|
7.58
|
4.49%
|
Pitching Wedge
The pitching wedge data from the NEO-E was the most accurate with a difference of just 1.6 yards or a percent difference of 1.48%. Take a look at the table below for the complete 20 shots and how they varied between the Driver, 6-iron and pitching wedge.
|
Shot
|
Real Life Carry Distance
|
Simulator Carry Distance
|
Yardage Difference
|
Percentage Difference
|
|
Shot 1
|
86 |
85.6 |
0.4 |
0.47% |
|
Shot 2
|
95 |
93.7 |
1.3 |
1.37% |
|
Shot 3
|
125 |
122.4 |
2.6 |
2.08% |
|
Shot 4
|
116 |
116.5 |
0.5 |
0.43% |
|
Shot 5
|
106 |
108.6 |
2.6 |
2.45% |
|
Shot 6
|
109 |
110.2 |
1.2 |
1.10% |
|
Shot 7
|
112 |
110.9 |
1.1 |
0.98% |
|
Shot 8
|
121 |
120 |
1 |
0.83% |
|
Shot 9
|
129 |
128.3 |
0.7 |
0.54% |
|
Shot 10
|
120 |
120.7 |
0.7 |
0.58% |
|
Shot 11
|
127 |
125.2 |
1.8 |
1.42% |
|
Shot 12
|
125 |
125.3 |
0.3 |
0.24% |
|
Shot 13
|
120 |
120 |
0 |
0.00% |
|
Shot 14
|
110 |
115.4 |
5.4 |
4.91% |
|
Shot 15
|
121 |
123.6 |
2.6 |
2.15% |
|
Shot 16
|
107 |
108.9 |
1.9 |
1.78% |
|
Shot 17
|
114 |
118.3 |
4.3 |
3.77% |
|
Shot 18
|
122 |
124.7 |
2.7 |
2.21% |
|
Shot 19
|
130 |
131.8 |
1.8 |
1.38% |
|
Shot 20
|
115 |
116 |
1 |
0.87% |
| |
|
Average
|
1.695
|
1.48%
|
NEO-E OVERALL
Based off the testing we did, it's pretty easy to draw the conclusion that the NEO-E does a solid job outdoors on the range. With an overall average yardage distance difference of 6.025 or 3.27% it comes in as a decently accurate launch monitor we have tested on the range.
The Nvisage NEO-E offers good accuracy and some great features that you can utilize while out on the driving or in your golf simulator.

